Gen Z Shopping Habits: Where Young Adults Spend and How They Shop Differently

Published
Oct 13, 2026
Last updated
October 14, 2026

From YipitData’s retail demographic data: Walmart, Amazon, and Target lead spending, while apparel, resale, and gaming set 18–24-year-olds apart.
Where they differ is in categories and brands. Gen Z shoppers (ages 18–24) put a 46% larger share of their retail spend into apparel, footwear, and accessories than the overall population does. They also shop resale, gaming, and social commerce platforms at much higher rates.
We analyzed retail demographic data from YipitData’s U.S. credit and debit card panel over the trailing 52 weeks, across eight major retail sectors from grocery to online.
What are Gen Z’s shopping habits?
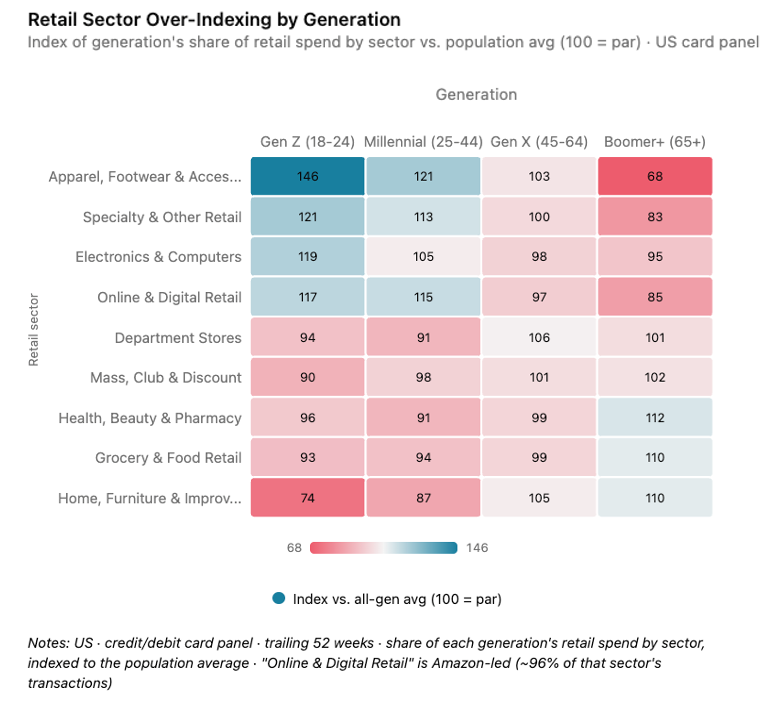
Gen Z shoppers spend most of their retail dollars at Walmart, Amazon, and Target. They spend a larger share than the average U.S. consumer on apparel, footwear, and accessories (index 146), electronics (119), and online and digital retail (117), and a smaller share on home and furniture (74) and grocery (93). They’re also far more likely than other consumers to shop resale platforms, gaming ecosystems, TikTok Shop, and youth apparel brands.
Gen Z shopping habits at a glance
| Finding | Data point |
|---|---|
| Largest share of wallet | Walmart, Amazon, Target |
| Strongest category over-index | Apparel, footwear & accessories (146) |
| Other over-indexed categories | Specialty (121), Electronics (119), Online & digital (117) |
| Under-indexed categories | Home & furniture (74), Mass & club (90), Grocery (93) |
| Most distinctive retailer types | Resale, gaming, social commerce, youth apparel |
| Most frequent relationships | Steam (12.9 transactions/yr), PlayStation (12.1), Patreon (10.9) |
| Biggest low-frequency spend | Lululemon ($243/yr), Abercrombie & Fitch ($242), Boot Barn ($215) |
Source: YipitData U.S. credit and debit card panel, consumers ages 18–24, trailing 52 weeks. Index of 100 = population average.
Where does Gen Z spend the most money?
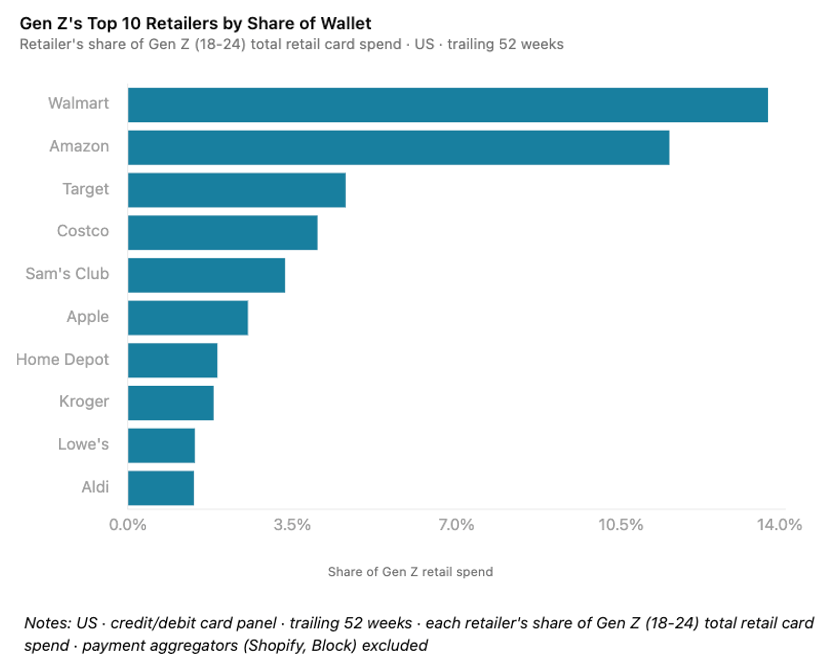
Gen Z spends the most at Walmart, Amazon, and Target, followed by Costco, Sam’s Club, Apple, Home Depot, Kroger, Lowe’s, and Aldi.
Gen Z shops these retailers for the same convenience and value as every other generation, even if it discovers products differently.
For retailers and brands, broad assortment, competitive value, and convenience remain the foundation for winning Gen Z. Pair those strengths with products and experiences that feel more relevant to younger shoppers.
Which retail categories does Gen Z over-index in?
Gen Z shopping habits look more distinct at the category level.
Consumers ages 18–24 over-index most in apparel, footwear, and accessories, with an index of 146 relative to the overall population. They also over-index in specialty retail (121), electronics (119), and online and digital retail (117). Amazon accounts for roughly 96% of online and digital retail transactions.
Gen Z under-indexes in home and furniture (74), mass and club (90), and grocery (93). Younger adults spend more on self-expression, entertainment, and digital purchases, and less on homes and household staples. That pattern reflects their life stage as much as shopping behavior.
For retailers and brands, Gen Z is easiest to reach in categories tied to identity, culture, and digital lifestyles. Retailers in more functional categories may need culturally relevant products, partnerships, and shopping occasions to compete for Gen Z spending.
Which retailers do Gen Z consumers shop more?
We use share of wallet to see where Gen Z spends the most, and over-indexing to see where Gen Z shops differently from the average consumer.
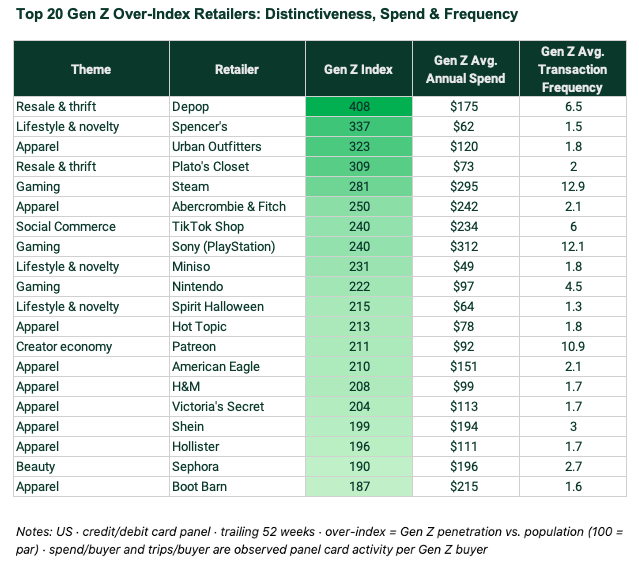
Gen Z over-indexes most at resale platforms. Gen Z shoppers are about four times as likely as the average consumer to shop at Depop, which has a Gen Z index of 408. Plato’s Closet, another resale chain, ranks in the top five. Gen Z also over-indexes at gaming ecosystems like Steam, PlayStation, and Nintendo, at TikTok Shop, and at youth-oriented apparel and lifestyle brands.
Gen Z spends less in total at these businesses than at the mass merchants, but a disproportionate share of Gen Z shoppers buy from them.
For retailers and brands, tracking where Gen Z over-indexes helps spot emerging competitors while they’re still small. Retailers who watch only market share can miss the platforms and experiences shaping what younger shoppers expect.
What are the two types of Gen Z retail relationships?
Gen Z shops its most distinctive retailers in two ways. It returns to some often and spends heavily at others a few times a year.
Frequent engagement: Gaming, resale, social commerce, and subscriptions
Gen Z returns to habit-forming platforms again and again. It averages 12.9 transactions a year with Steam, 12.1 with PlayStation, 10.9 with Patreon, 6.5 with Depop, and 6.0 with TikTok Shop. Shoppers keep coming back for new content, changing inventory, and community.
Considered splurges: Apparel and lifestyle brands
Gen Z shops identity-driven apparel and lifestyle brands less often but spends more each time. Gen Z shoppers spend an average of $243 a year with Lululemon, $242 with Abercrombie & Fitch, and $215 with Boot Barn, across about two visits a year at each. They treat these as considered purchases tied to personal style, so each visit has to feel worth it.
For retailers and brands, the right Gen Z strategy depends on the model. Habit-forming platforms should prioritize frequency, community, and loyalty. Higher-ticket brands should focus on culturally relevant launches, seasonal moments, and distinctive products that make each purchase worth it.
How should retailers analyze Gen Z shopping habits?
Retailers should track share of wallet to see where Gen Z spends today. By that measure, Gen Z still spends much of its money at Walmart, Amazon, and Target.
Retailers should also track over-indexing to see which behaviors could shape retail tomorrow. Younger shoppers already discover, evaluate, and engage with brands through resale, gaming, social commerce, and identity-led apparel.
How YipitData measures Gen Z spending
This analysis uses retail demographic data from YipitData’s U.S. credit and debit card panel, covering 9M+ real consumers. We measured card spending by consumers ages 18–24 over the trailing 52 weeks across major retail sectors. YipitData uses the same transaction data in its insights for corporations.
- Share of wallet: Each retailer’s share of Gen Z’s total retail card spend. Payment aggregators such as Shopify and Block are excluded.
- Category index: Gen Z’s share of retail spend in a sector compared with the population average, where 100 equals par.
- Retailer index: The share of Gen Z consumers who shop a retailer compared with the share of all consumers who do.
- Annual spend and frequency: Card activity per Gen Z buyer at each retailer.
See how your category and brands index with Gen Z shoppers. Explore YipitData for retail.
Frequently Asked Questions
What does credit and debit card data show about Gen Z shopping habits?
Credit and debit card data shows where Gen Z spends, how much, and how often. YipitData's U.S. card panel of 9M+ consumers compares Gen Z's spending with the overall population across retailers and categories.
What is retail demographic data?
Retail demographic data shows how consumer groups, such as age cohorts or generations, shop across retailers and categories. Companies collect it through surveys, loyalty programs, or transaction records. YipitData builds its retail demographic data from a U.S. credit and debit card panel, so it reflects actual purchases, including share of wallet, spend, and frequency by generation.
What age range does Gen Z cover?
This analysis covers Gen Z shoppers ages 18–24. YipitData measured their U.S. credit and debit card spending over the trailing 52 weeks.
What’s the difference between share of wallet and over-indexing?
Share of wallet shows where Gen Z spends the most today, mainly at Walmart, Amazon, and Target. Over-indexing shows where Gen Z shops differently, such as resale, gaming, and social commerce.
What does it mean when Gen Z over-indexes in a category?
An over-index means Gen Z spends a larger share of its budget in a category, or shops a retailer at a higher rate, than the overall population. An index of 100 equals the population average. Gen Z's apparel index of 146 means Gen Z spends a 46% larger share of its retail budget on apparel than the average consumer does.
.svg)
Speak to our Insights team


.svg)