“Partnering with YipitData has opened up previously inaccessible industry and retailer data to create a broad and accurate view of our market landscape, which continues to enable high conviction decision making and external proposals.”
Make smarter business decisions with visibility on your custom market share by brand, retailer, or vertical
with 7-10 days lag


“Partnering with YipitData has opened up previously inaccessible industry and retailer data to create a broad and accurate view of our market landscape, which continues to enable high conviction decision making and external proposals.”
.svg)
As new datasets become available with varying levels of accuracy, quality and compliance adherence.
.svg)
With each specialized data vendor only contributing to a fraction of the full picture.

Stitching together sources of partial truth to tell a cohesive story to your organization.

Educating users on which data sources to use to answer which business questions.
Our proprietary approach combines various data sources (physical/email receipt, credit card, web-scraped, etc) with predictive modeling to give you the most accurate and granular read on market performance with only 7-10 days lag.

.webp)
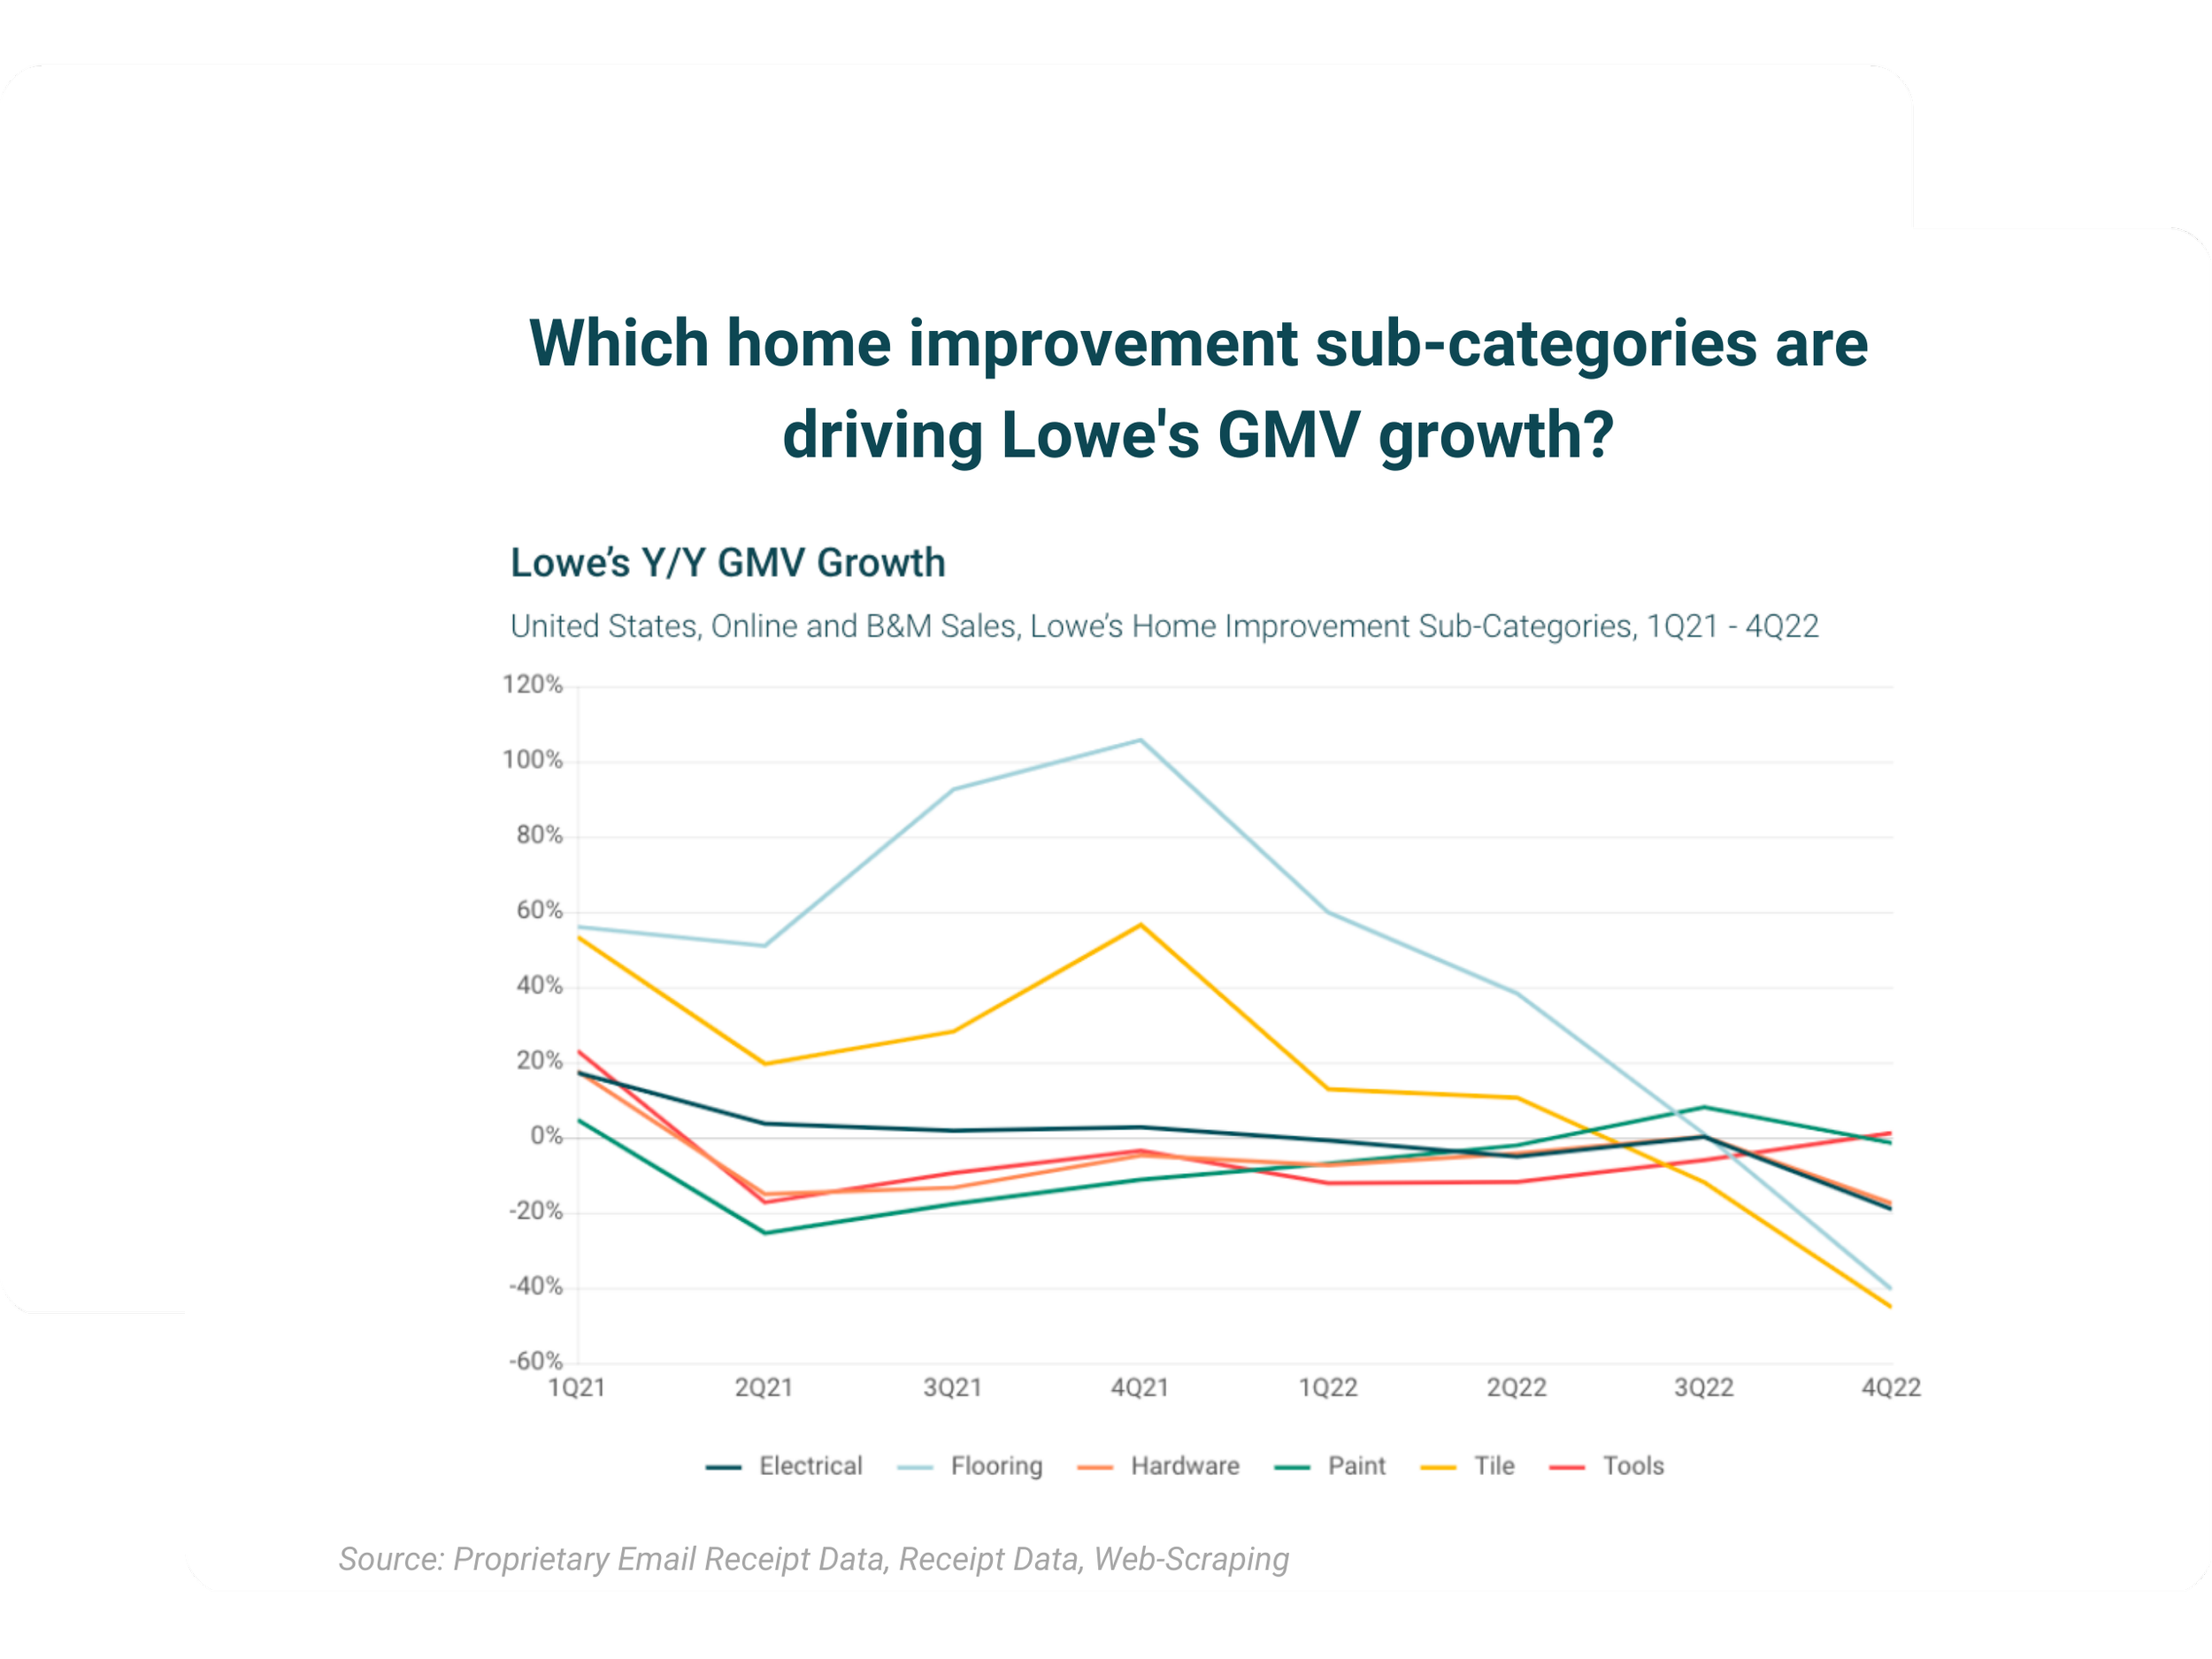
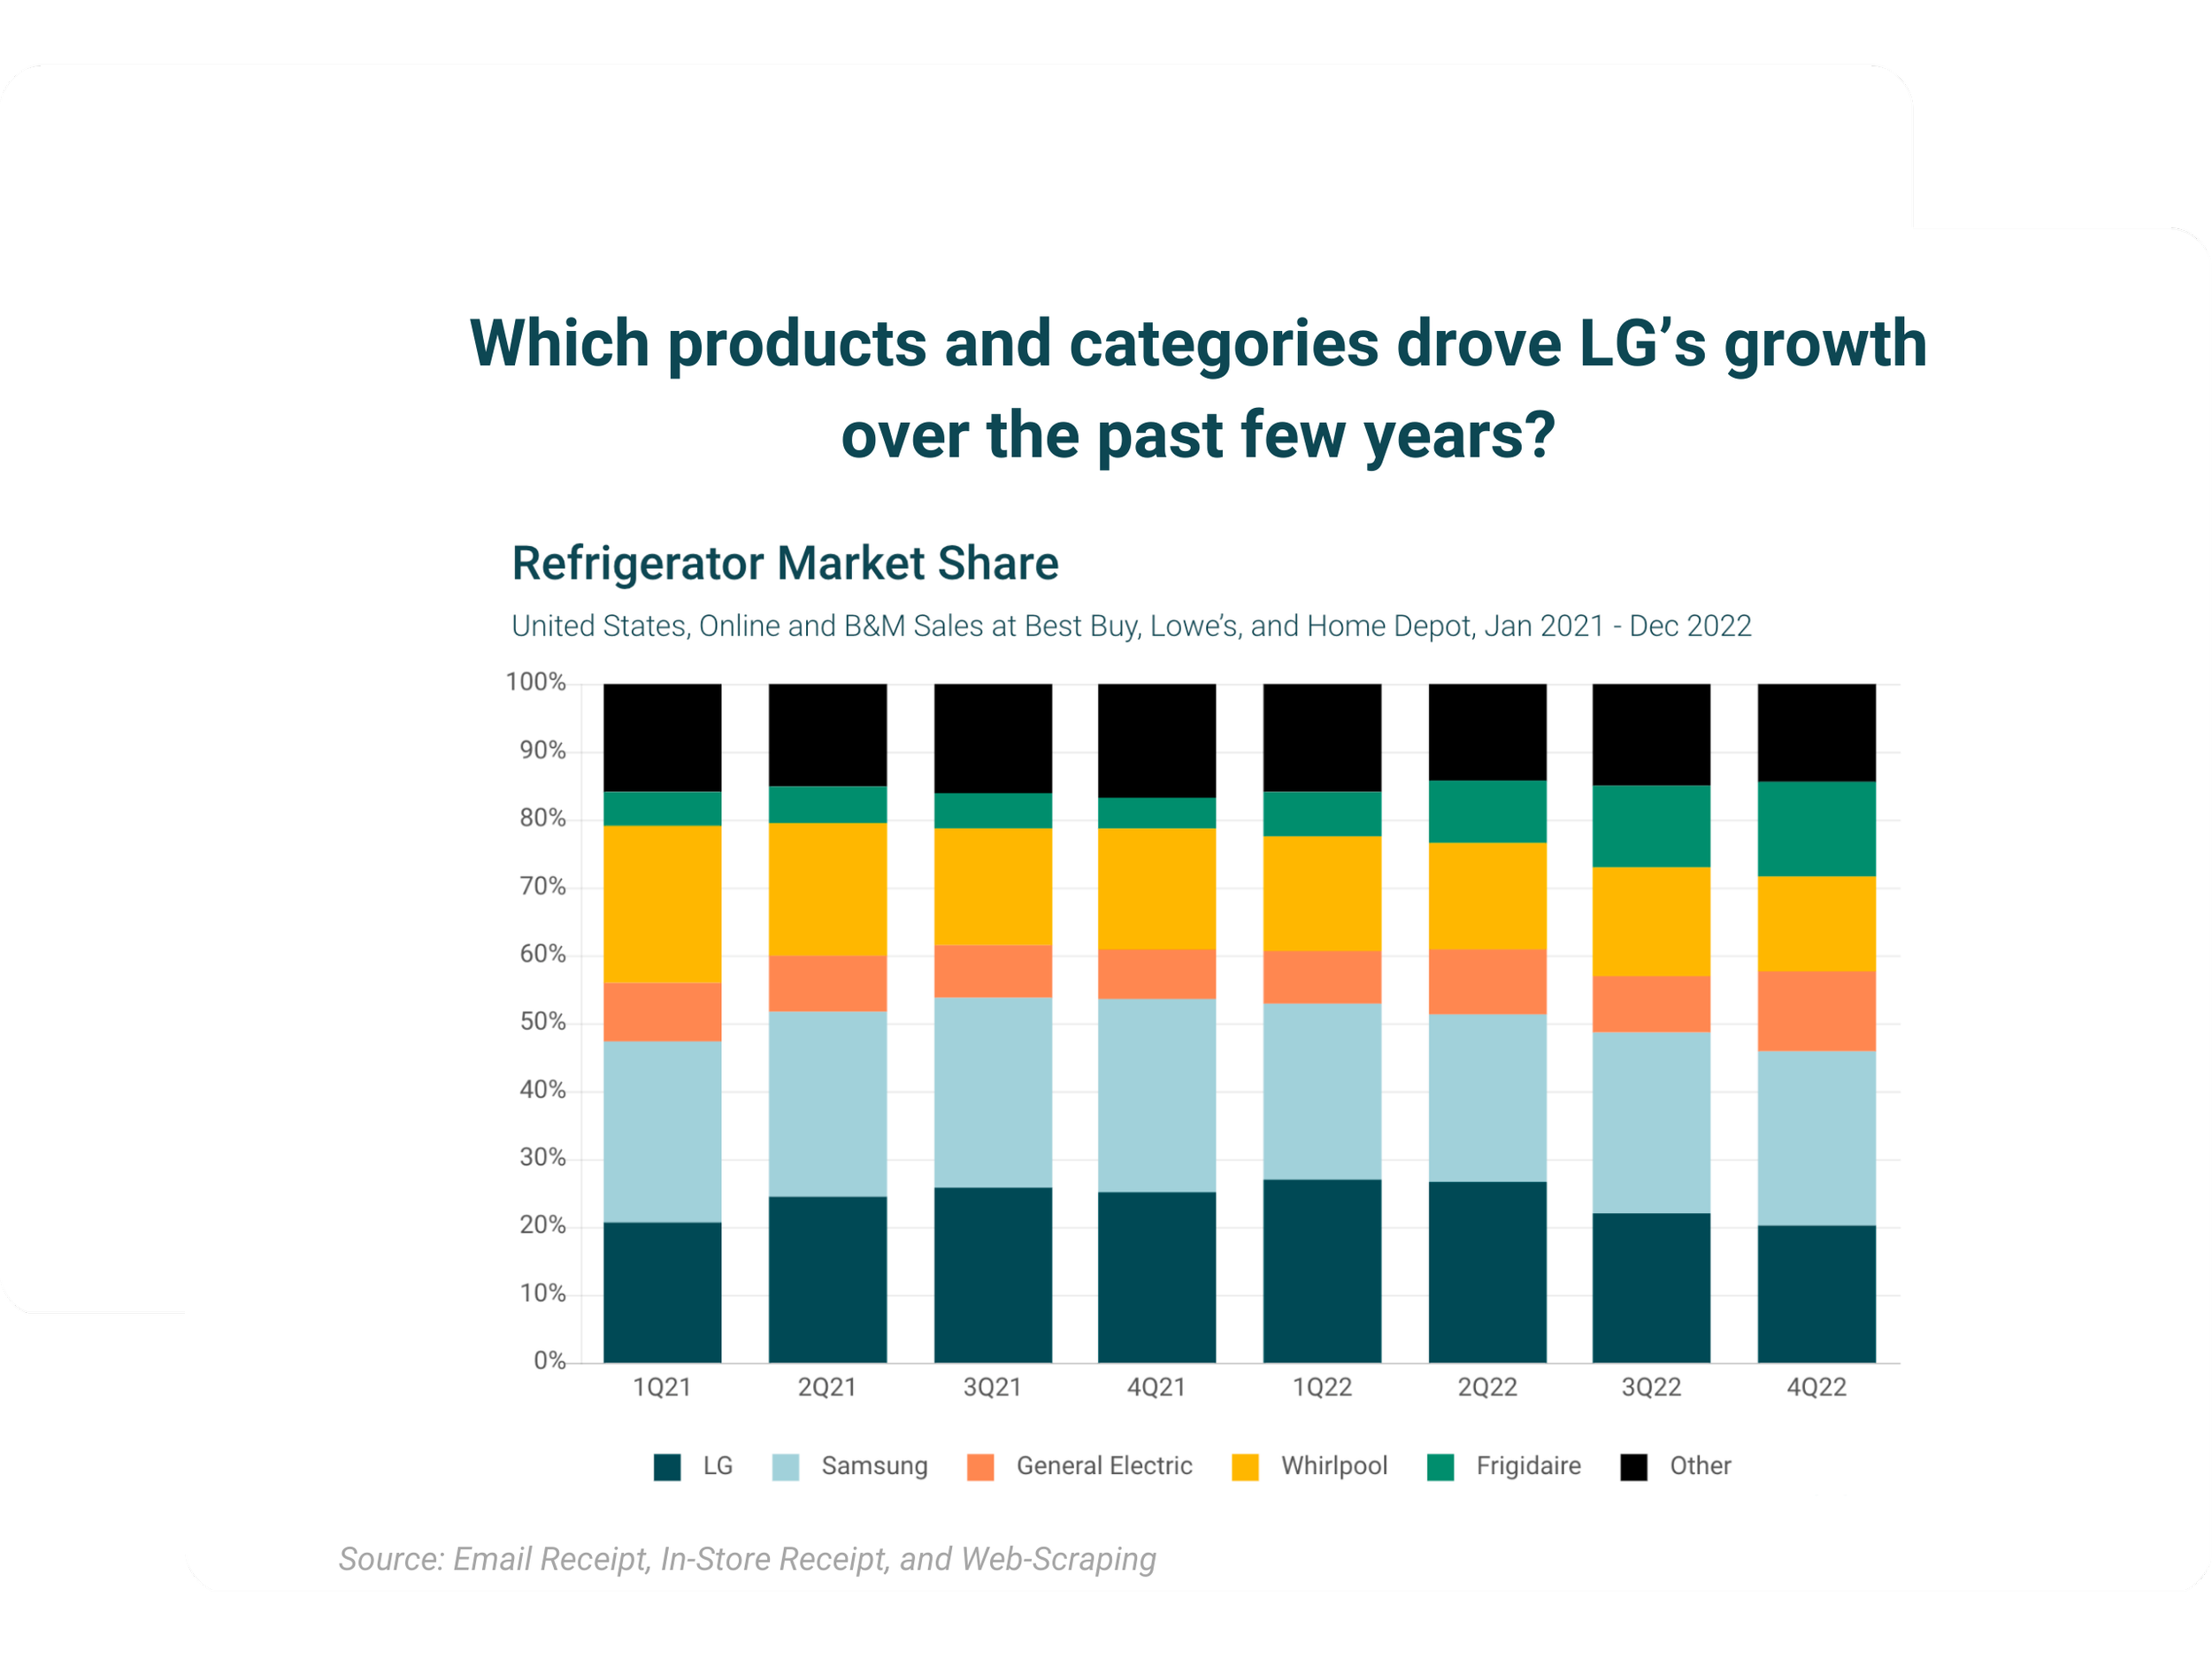
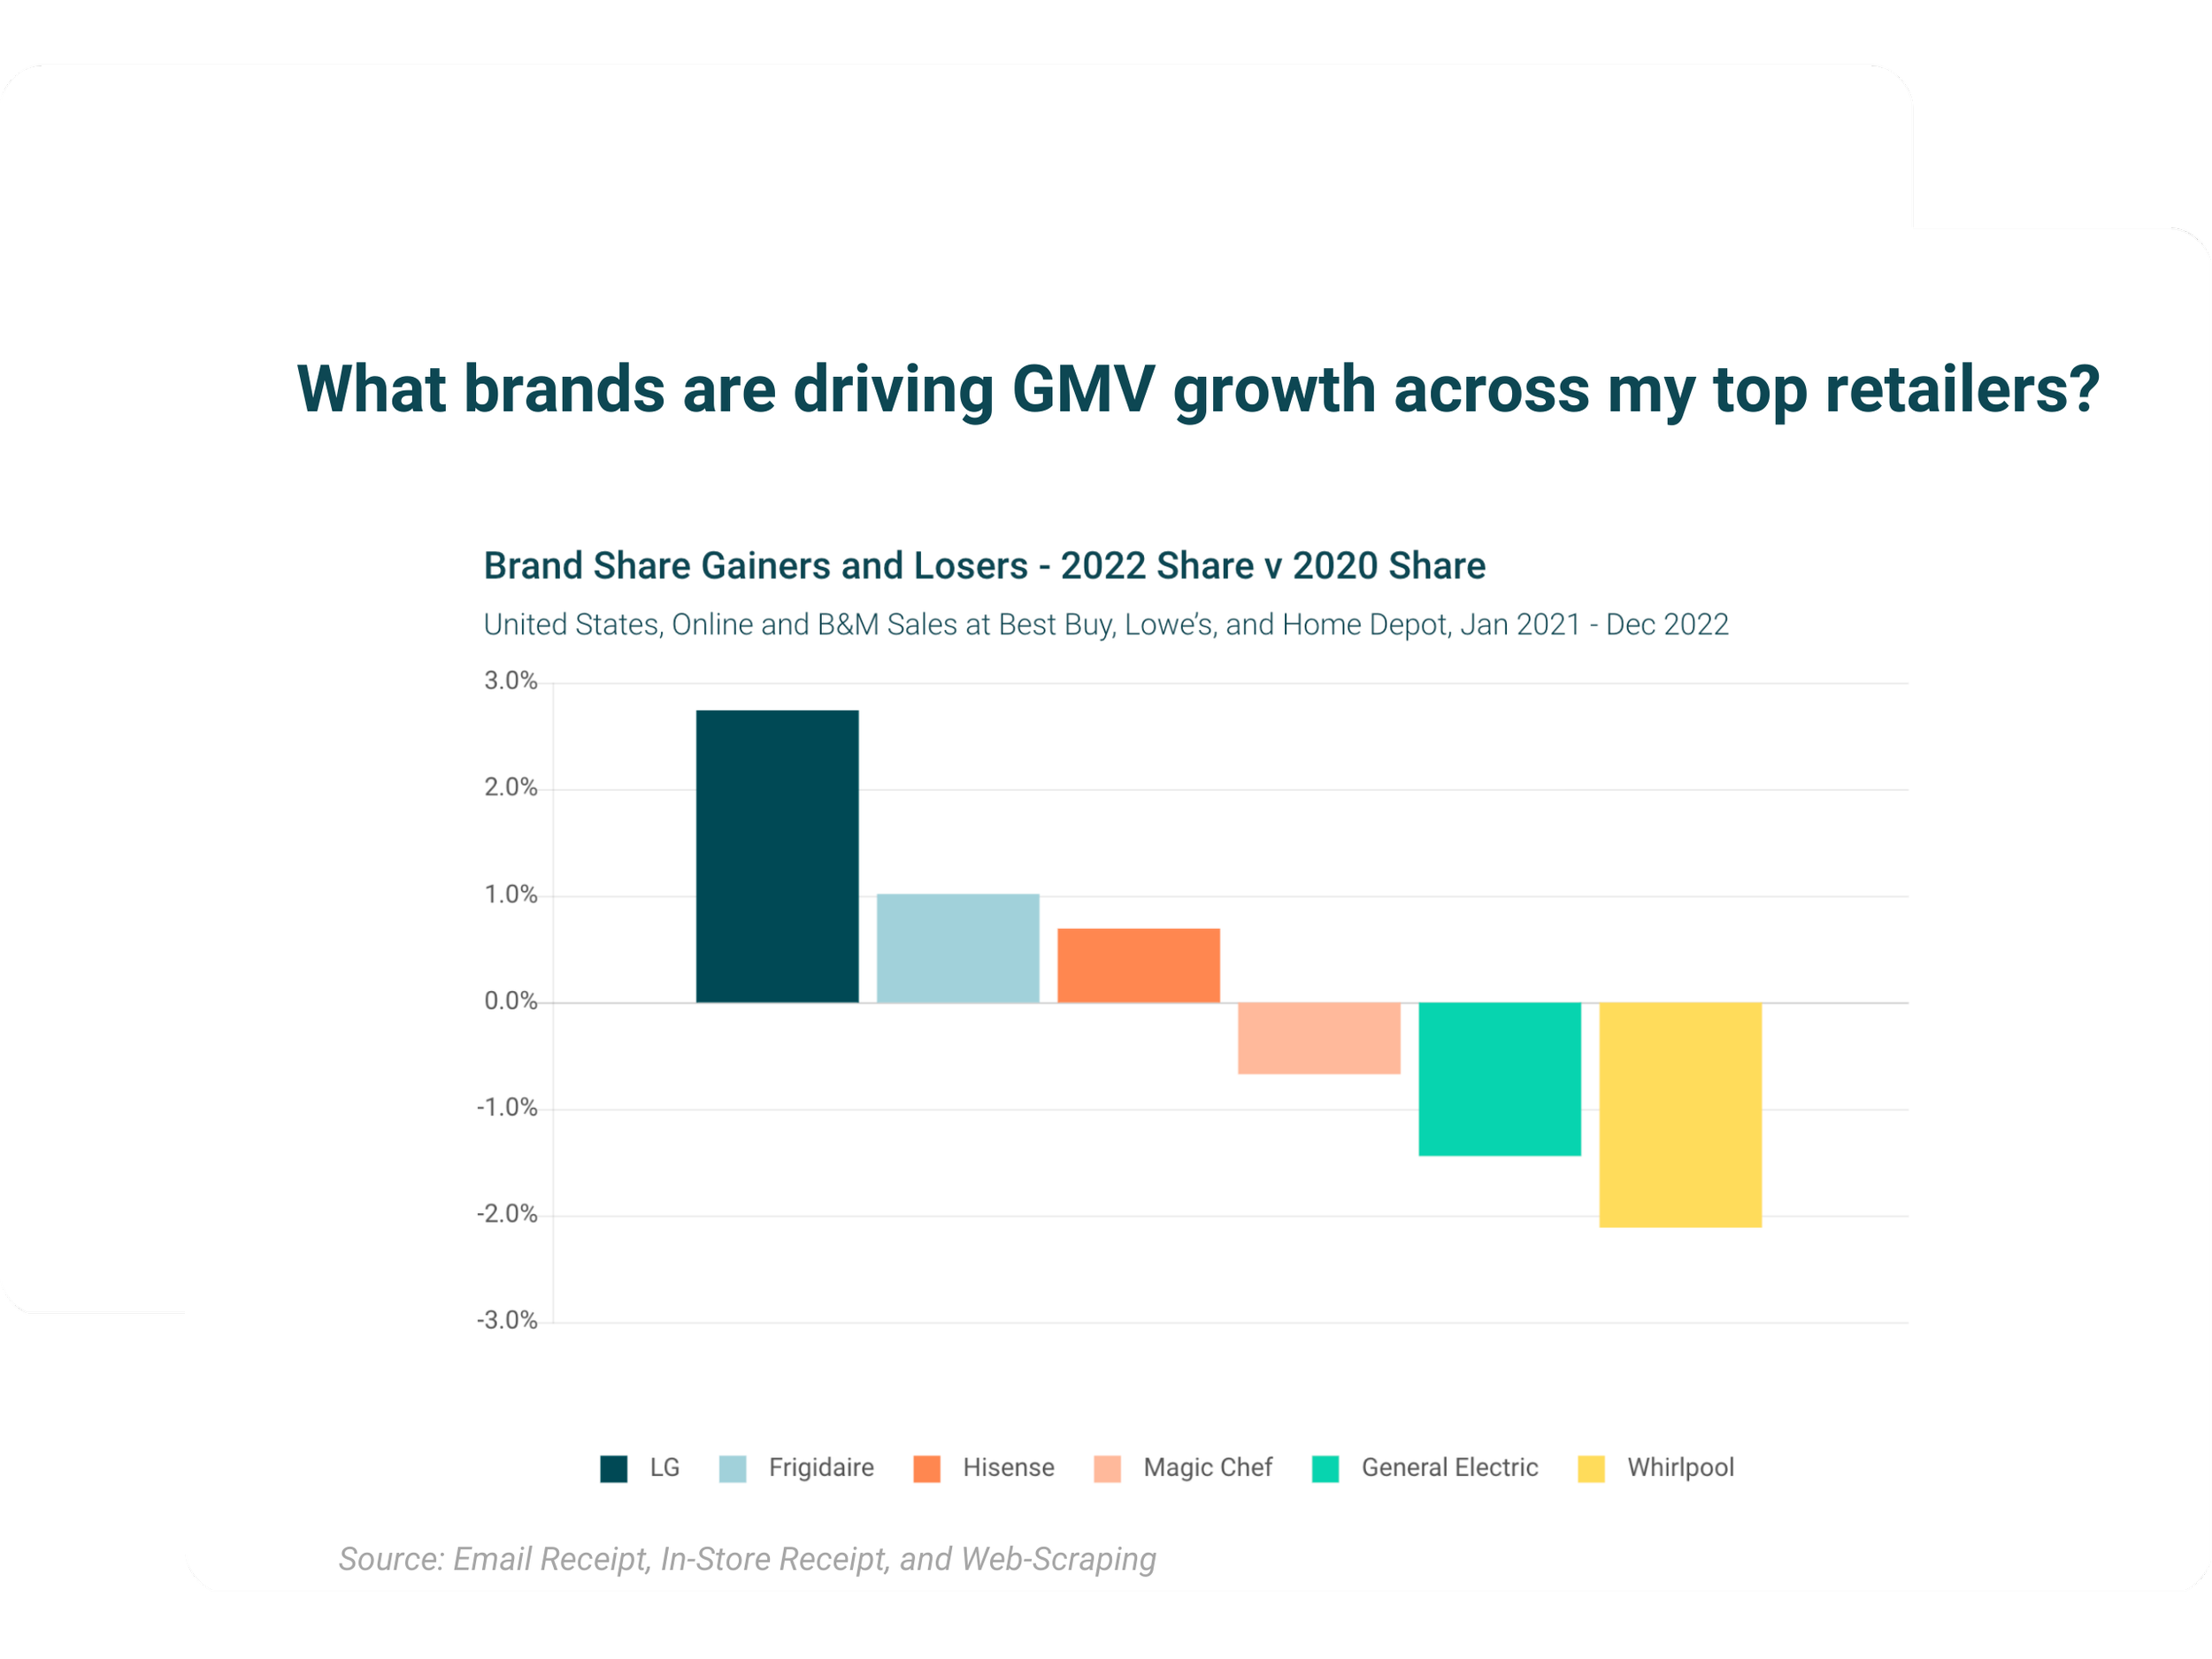
Contextualize your performance with sales data by competitor brand in your categories across your key retailers (incl Amazon, Home Depot, and Lowe’s)
Better anticipate customer needs by understanding their purchasing patterns, including share of wallet, loyalty, frequency, cross-purchasing analysis and more
Exclusive Pro’s insights on category trends and behavior diagnostic using our proprietary panel of 40k active builders
Summer is the most important season for the Grills & Griddles market. Download this report for a data-driven look at retailer and brand market share trends, product category performance, pricing dynamics, regional demand patterns, basket attachment behavior, and Memorial Day performance heading into peak grilling season.

YipitData analyzes Sephora's Spring Savings Event and Ulta's 21 Days of Beauty to reveal market share shifts, ecommerce vs. in-store behavior, category trends across makeup, skincare, fragrance, and hair care, and the top gaining brands and bestselling SKUs of the Spring 2026 promotional season.
.webp)