Feminine Care Market Trends 2026: Where the Growth Is

Published
Nov 17, 2026
Last updated
November 17, 2026


This article looks at feminine care market growth in the US through YipitData’s receipt-level transaction data for the year ending August 2026. It covers which segments are growing fastest, whether pad growth is coming from price or volume, how share is shifting across retailers and brands, and who is buying pads, closing with what these shifts mean for pricing, assortment and channel strategy in 2026.
Key Takeaways:
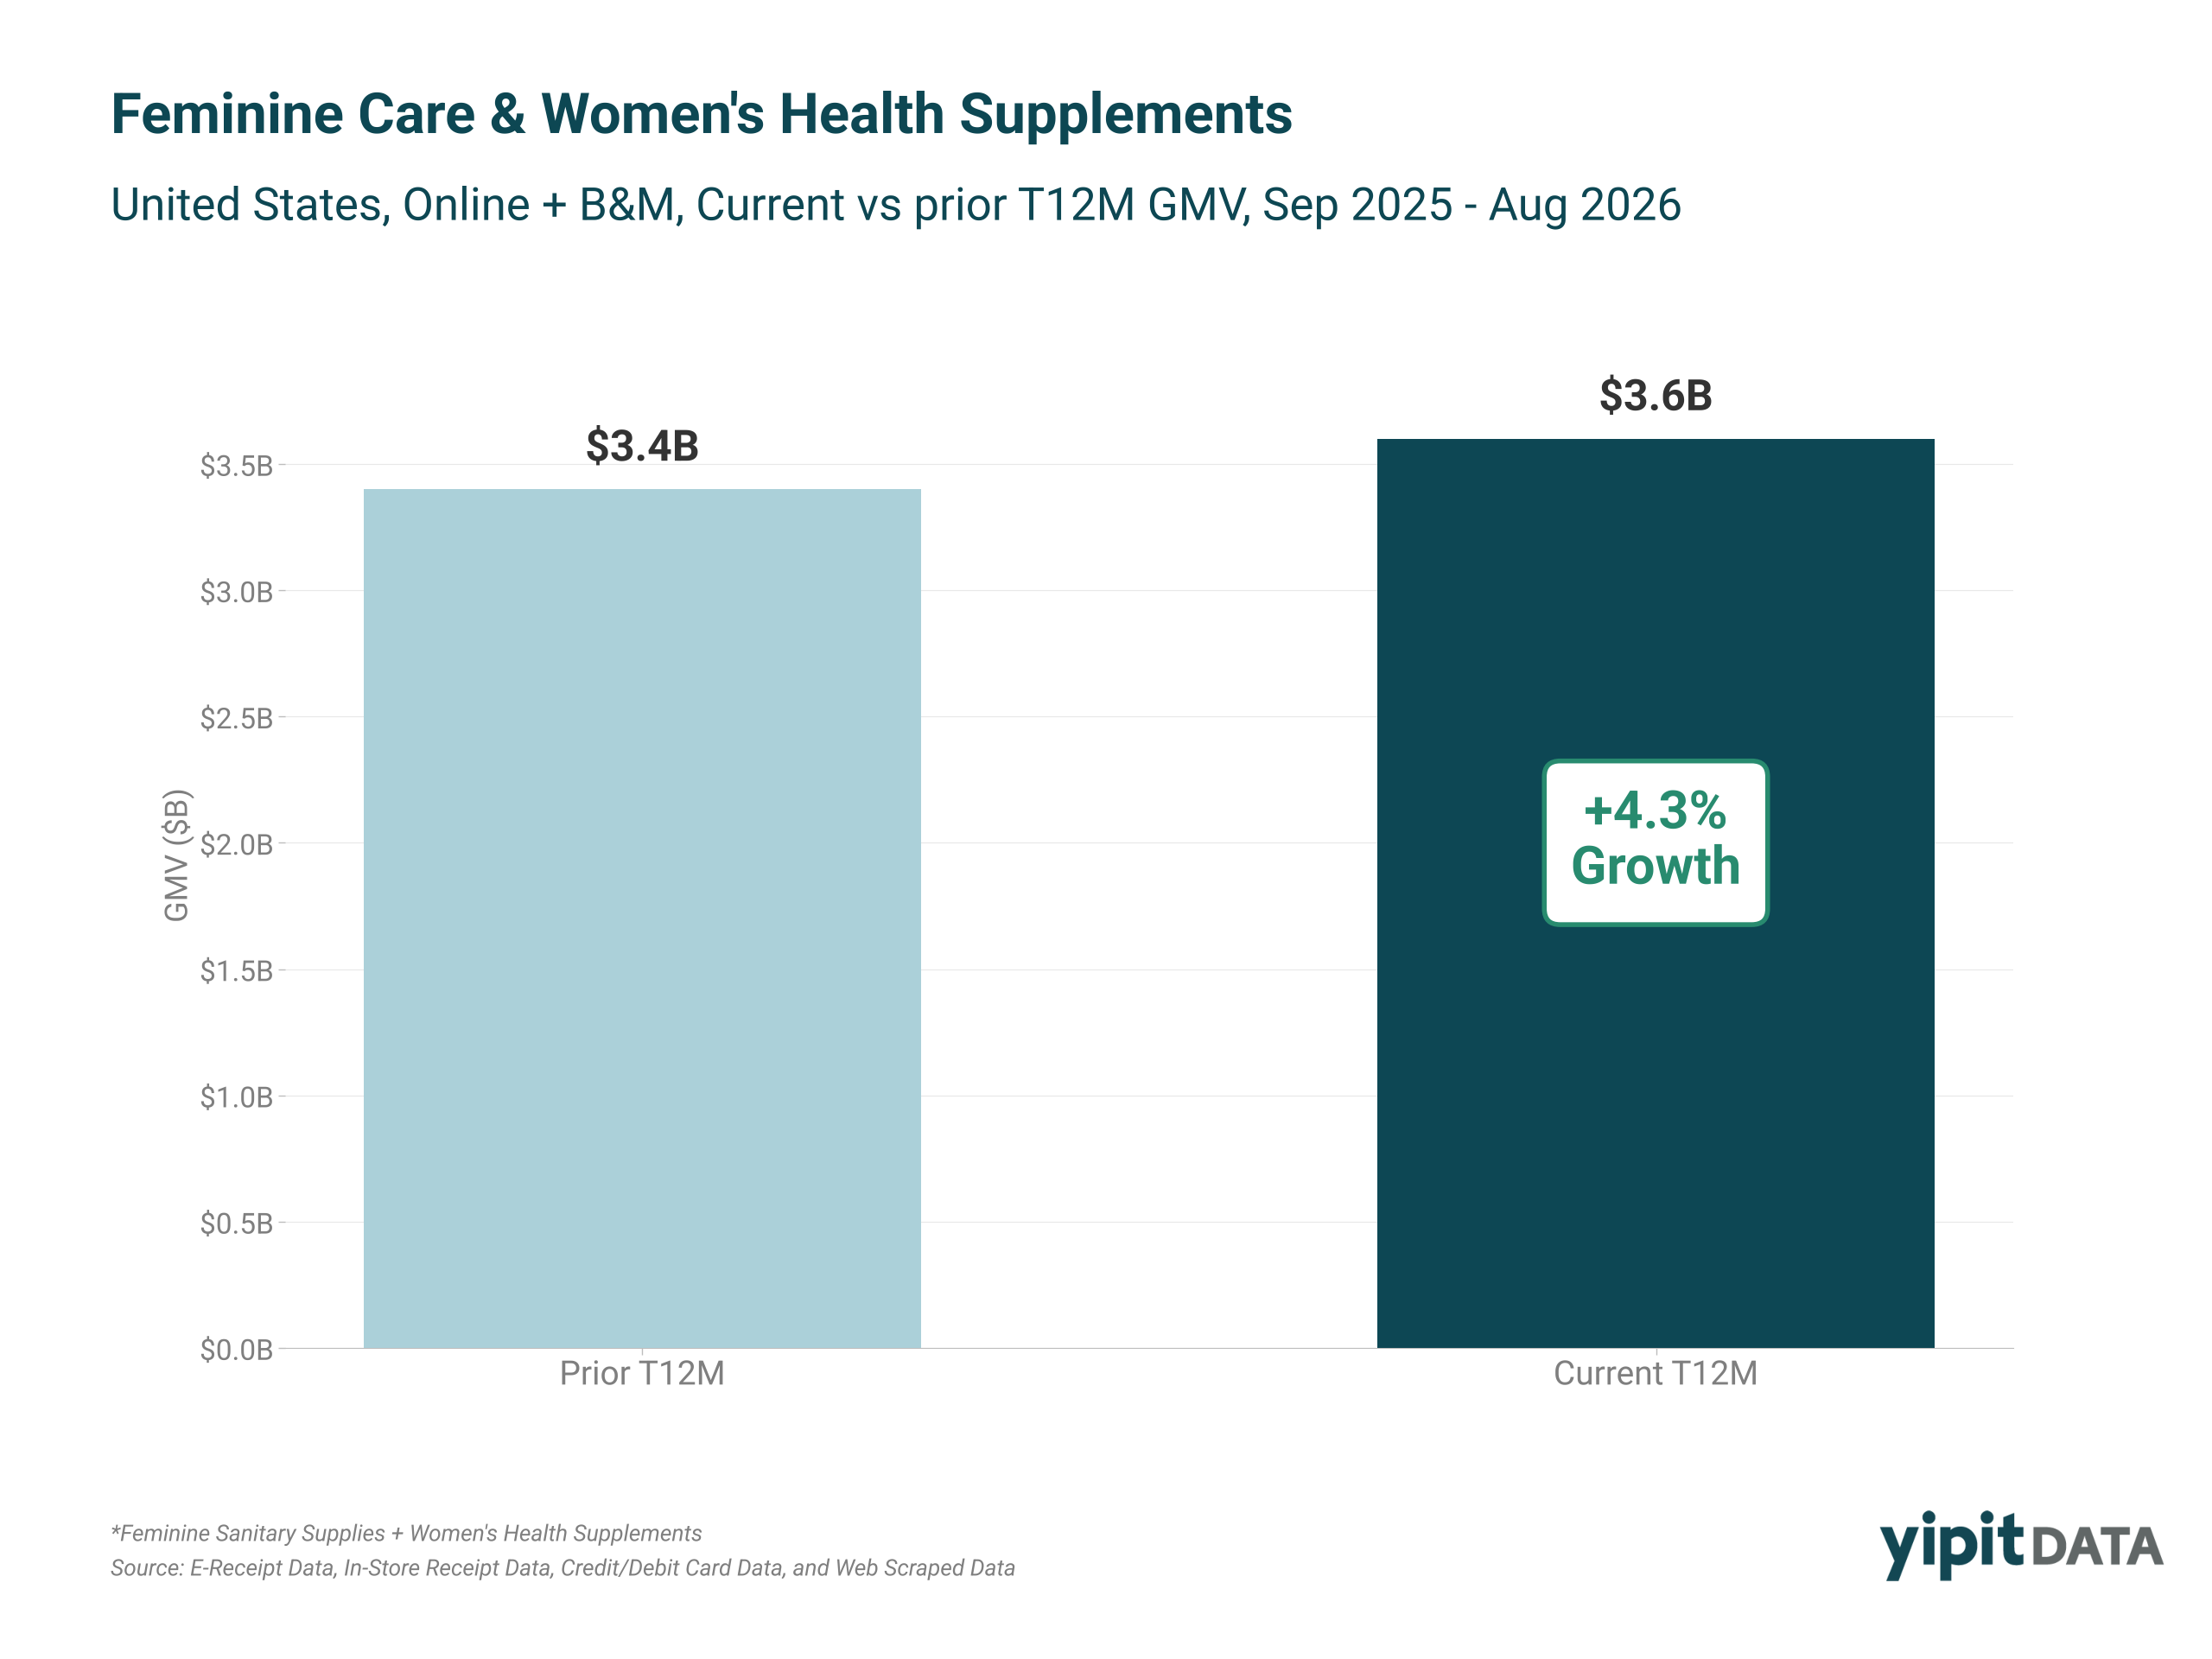
- Tracked US feminine care and women’s health supplements reached $3.6B in the twelve months ending August 2026, up 4.3%. Units fell 3.9% while average selling price rose 8.5% to $9.02, so growth came from price and mix rather than demand.
- Women’s health supplements grew 12.7% to $449.3M, four times the pace of pads (+2.9%).
- Standard and overnight pads hold 84.4% of pad GMV, with standard declining 3.3% and overnight growing 2.4%; leak protection grew 112.1% and natural/organic 35.7%.
- Amazon 1P and 3P each gained 1.2pp of pad share while dollar and drug retailers lost ground. Walmart and Target still hold 42.9%.
- Always kept 60.9% of pad GMV while Honey Pot, Cora, Rael, L. and Stayfree each gained 0.5 to 0.9pp.
How big is the US feminine care market in 2026, and is it still growing?
The tracked category, feminine sanitary supplies plus women’s health supplements, is worth $3.6B in GMV and grew 4.3% over the prior twelve months, up from $3.4B. But the growth came from price and mix rather than demand. Units declined 3.9% across the period, and the 8.5% increase in average selling price more than covered the gap. The analysis does not isolate list-price changes from shifts in product, pack-size, retailer and promotional mix.
That pattern matters for how to read the rest of the data. In a category where higher average prices are offsetting lower unit sales, the brands holding units are the ones gaining ground relative to the field. Two levers separate the winners: clear product benefits that justify the shelf price, and accessible price-pack options that keep the entry point within reach.
Which feminine care segments are growing fastest?
Women’s health supplements, at +12.7%, and feminine douches and creams, at +10.3%, grew fastest. The two largest segments, pads (+2.9%) and tampons (+0.6%), grew slowest among the gainers. Pads remain the anchor of the category at 52.7% of GMV, but the momentum is in adjacent need states.
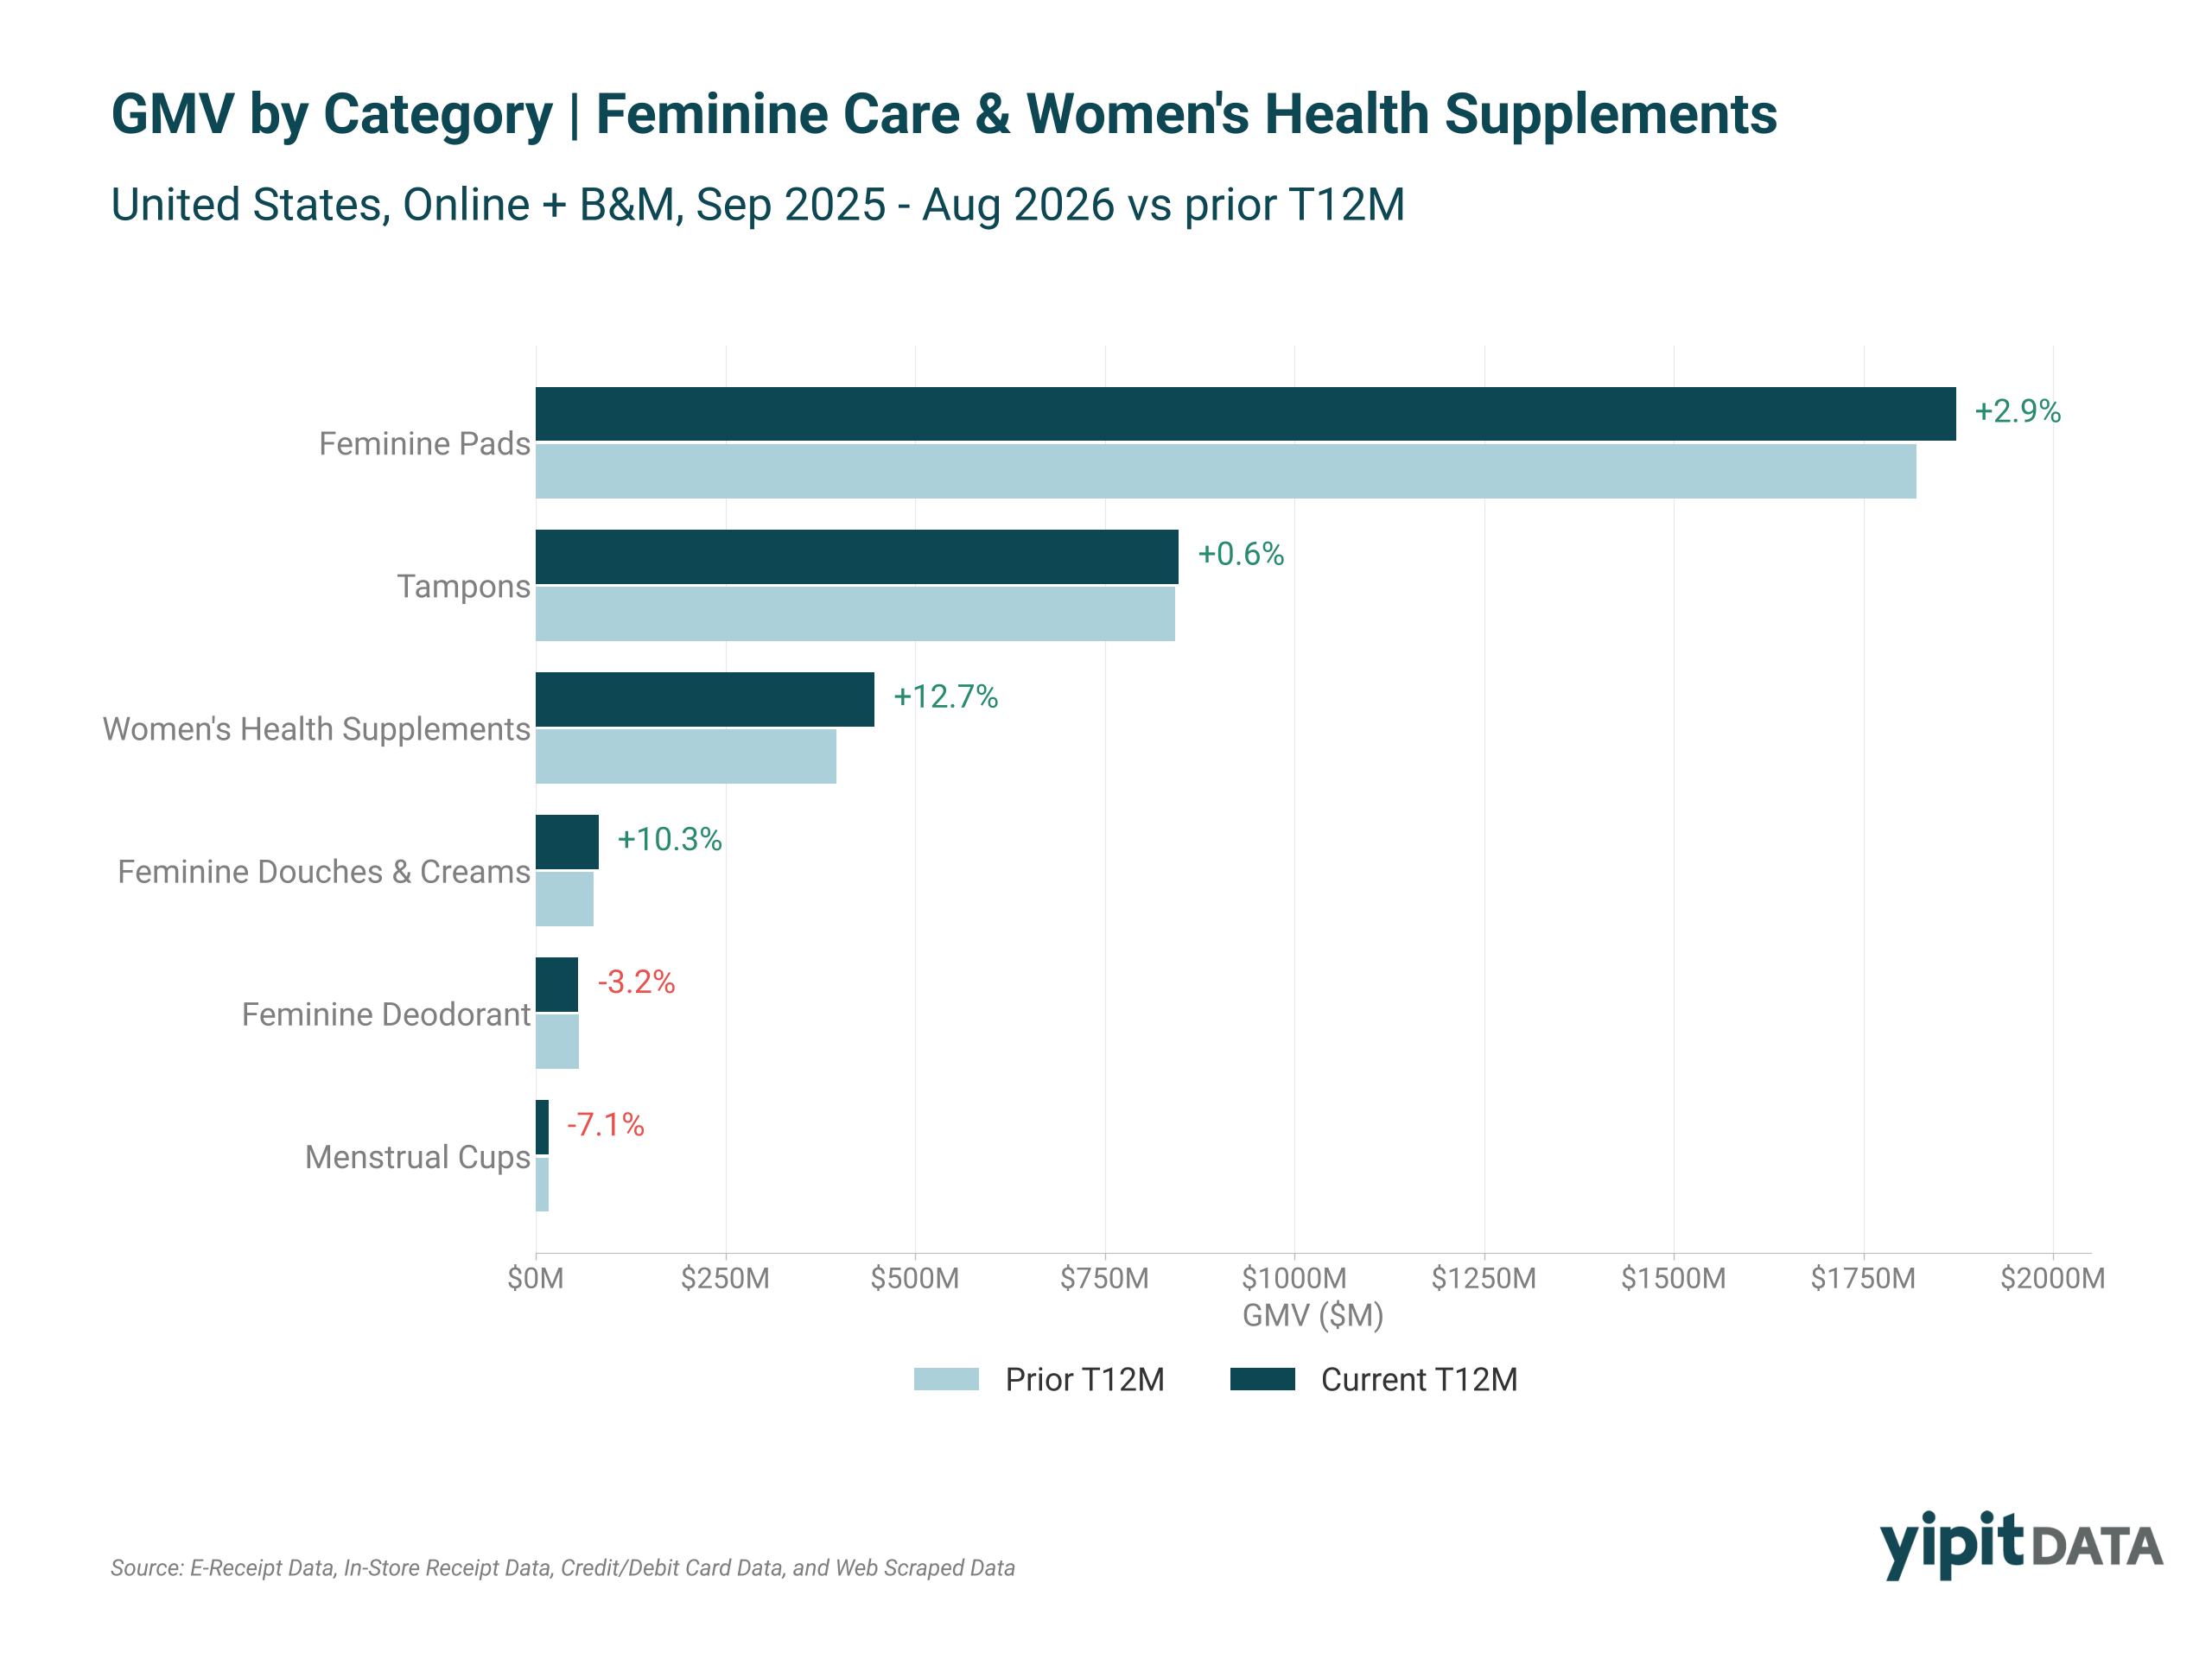
Women’s health supplements reached $449.3M and outgrew the overall market by roughly three times. The segment spans menopause, cycle, urinary and vaginal health, lactation and fertility, needs that extend across life stages well beyond traditional period care. For a category long defined by one monthly occasion, that broadening of the addressable shopper is the most important structural shift in the data. The declines in feminine deodorant and menstrual cups, meanwhile, show that not every adjacent product is benefiting. The growth is concentrated in supplements and treatments, not in alternative period formats.
Is pad growth coming from price or volume?
Price and mix. Pad GMV grew 2.9% while pad units fell 4.7%, with a 7.9% increase in average selling price offsetting the volume decline and carrying the segment into positive dollar growth. The pattern held throughout the year: monthly pad ASP climbed from a low near $7.7 in April 2026 to $8.3 by August 2026.
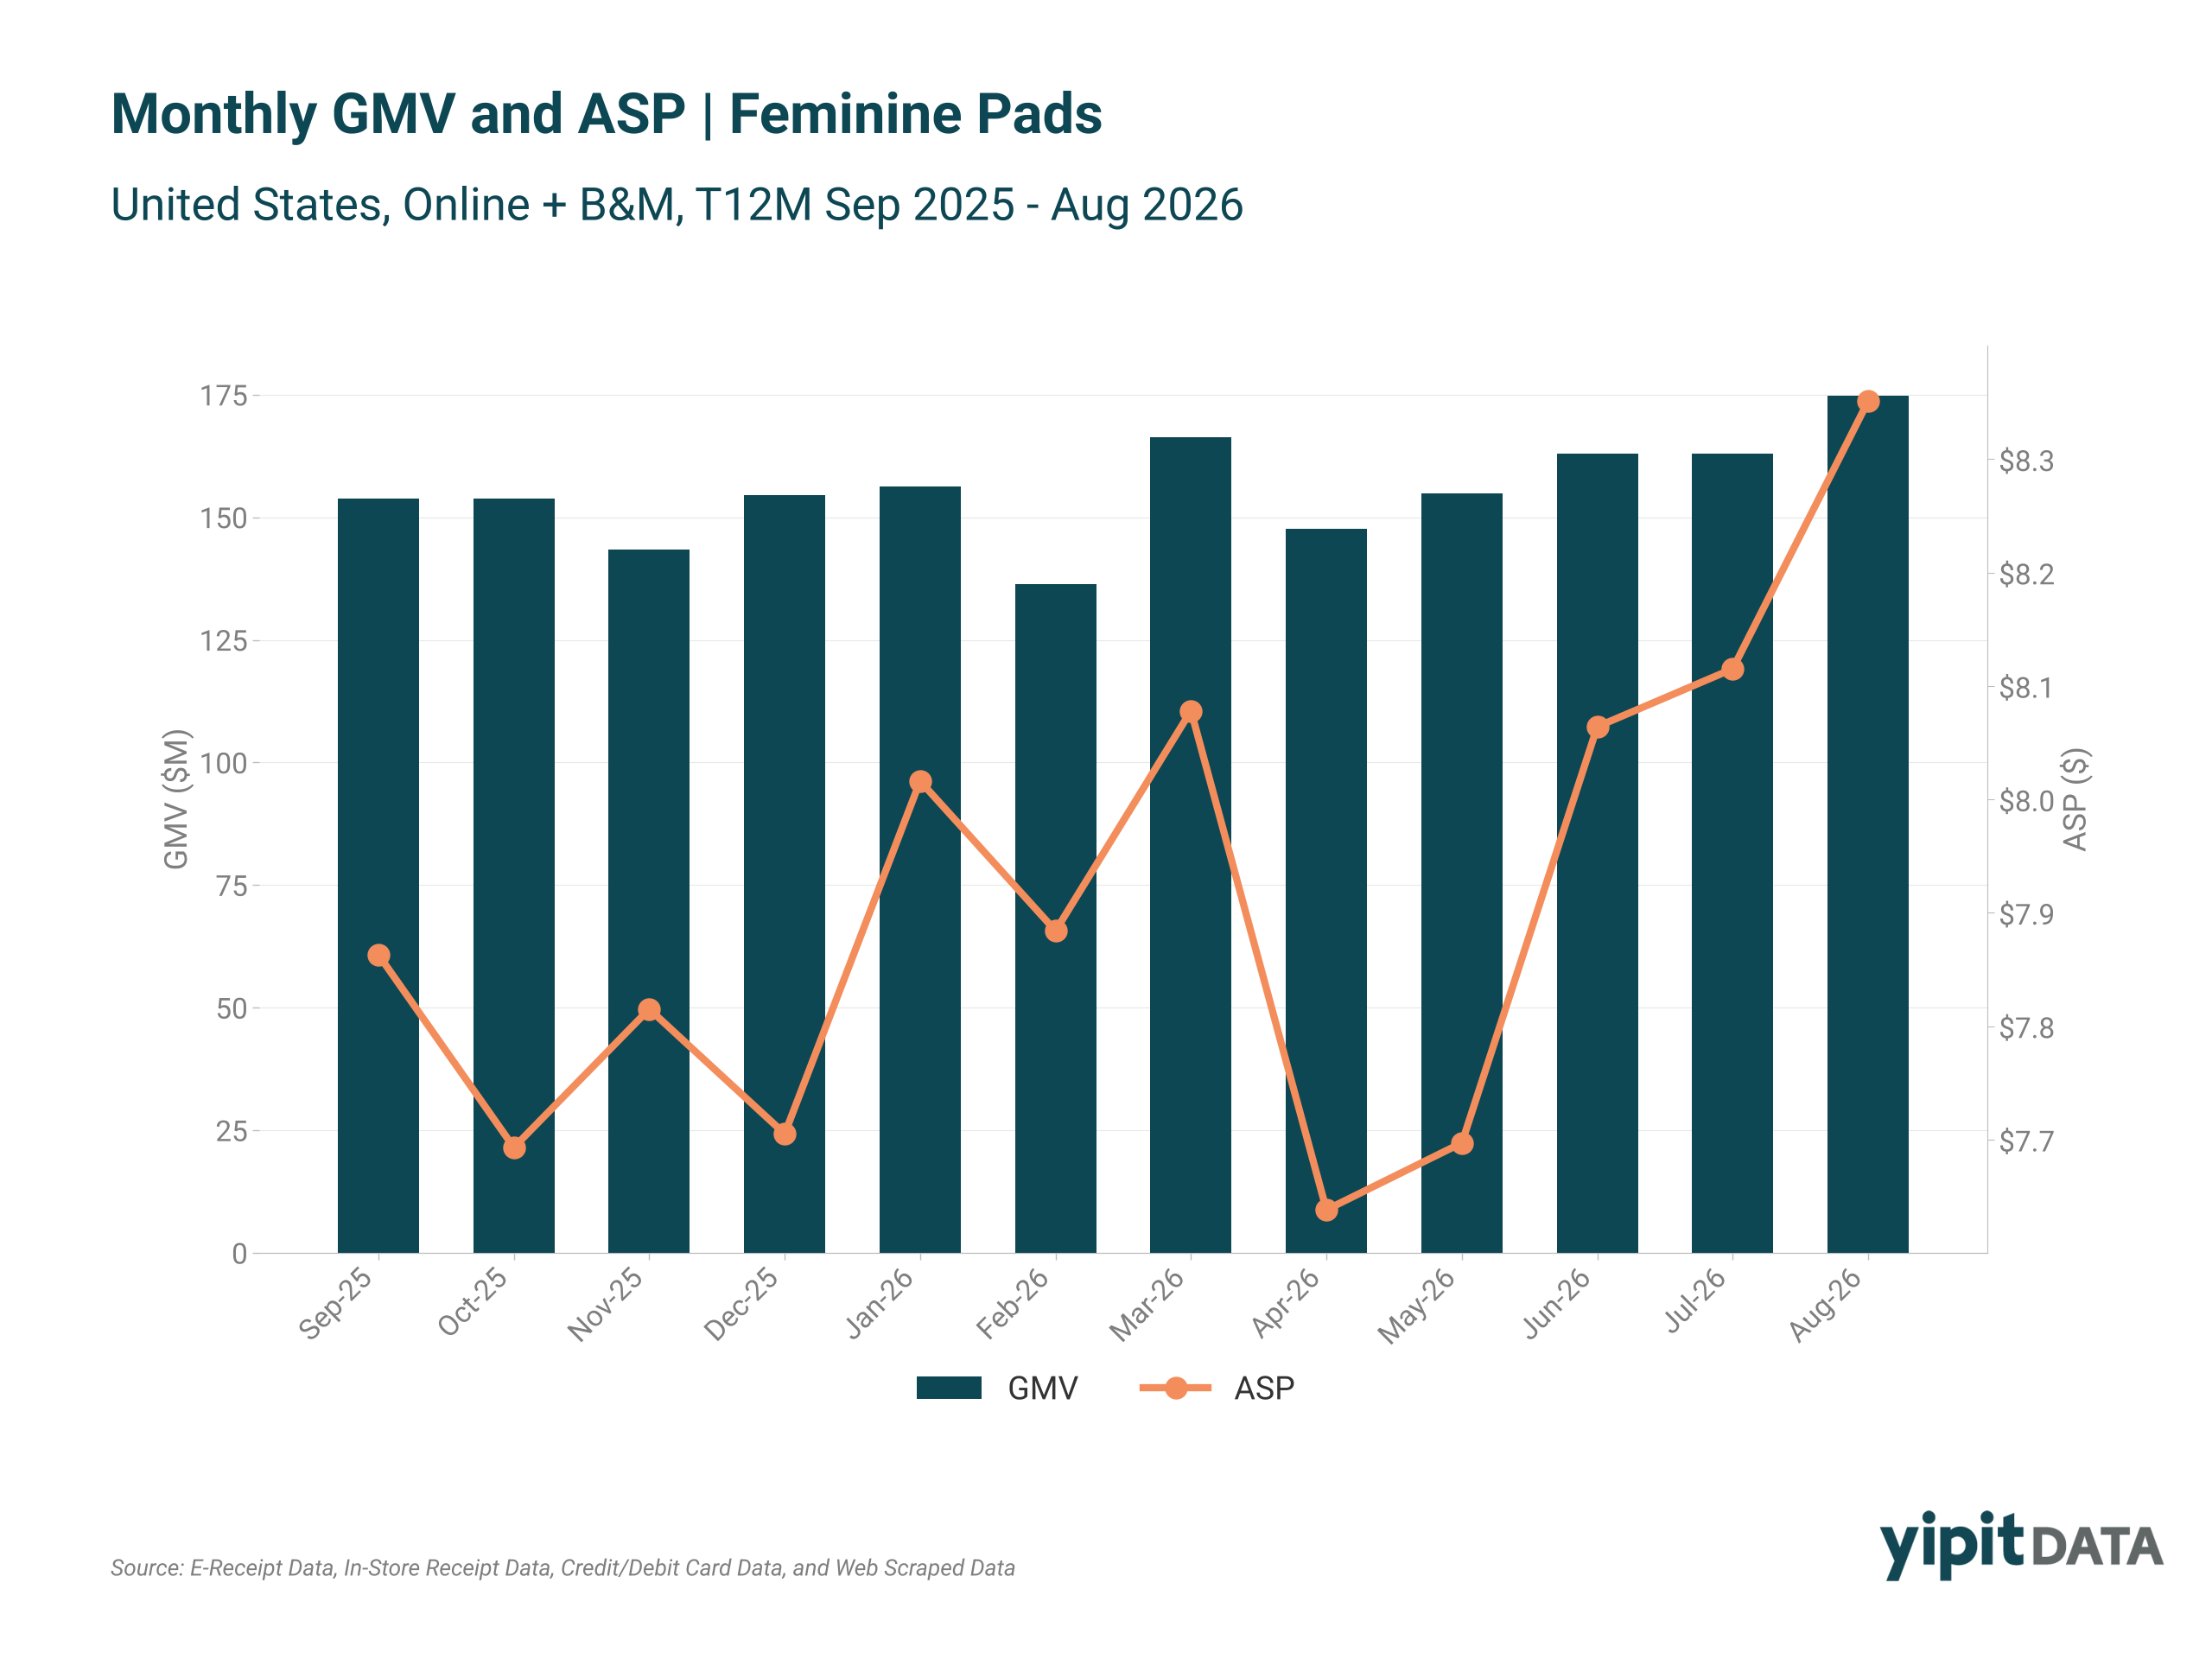
A unit decline that steep is a warning sign even when dollars are up. It means the segment is more dependent on average selling price than the top line suggests. Reinforcing perceived value, through benefit communication and price-pack architecture that includes accessible entry points, is what protects unit demand while prices move up.
Which types of pads are gaining, and which are losing?
The two largest segments, standard pads and overnight, account for 84.4% of pad GMV. Within them, standard pads declined 3.3% while overnight grew 2.4%, which the report reads as a shift toward defined use cases. The fastest growth is at the small end of the market, where leak-protection pads grew 112.1% and natural/organic pads grew 35.7%.
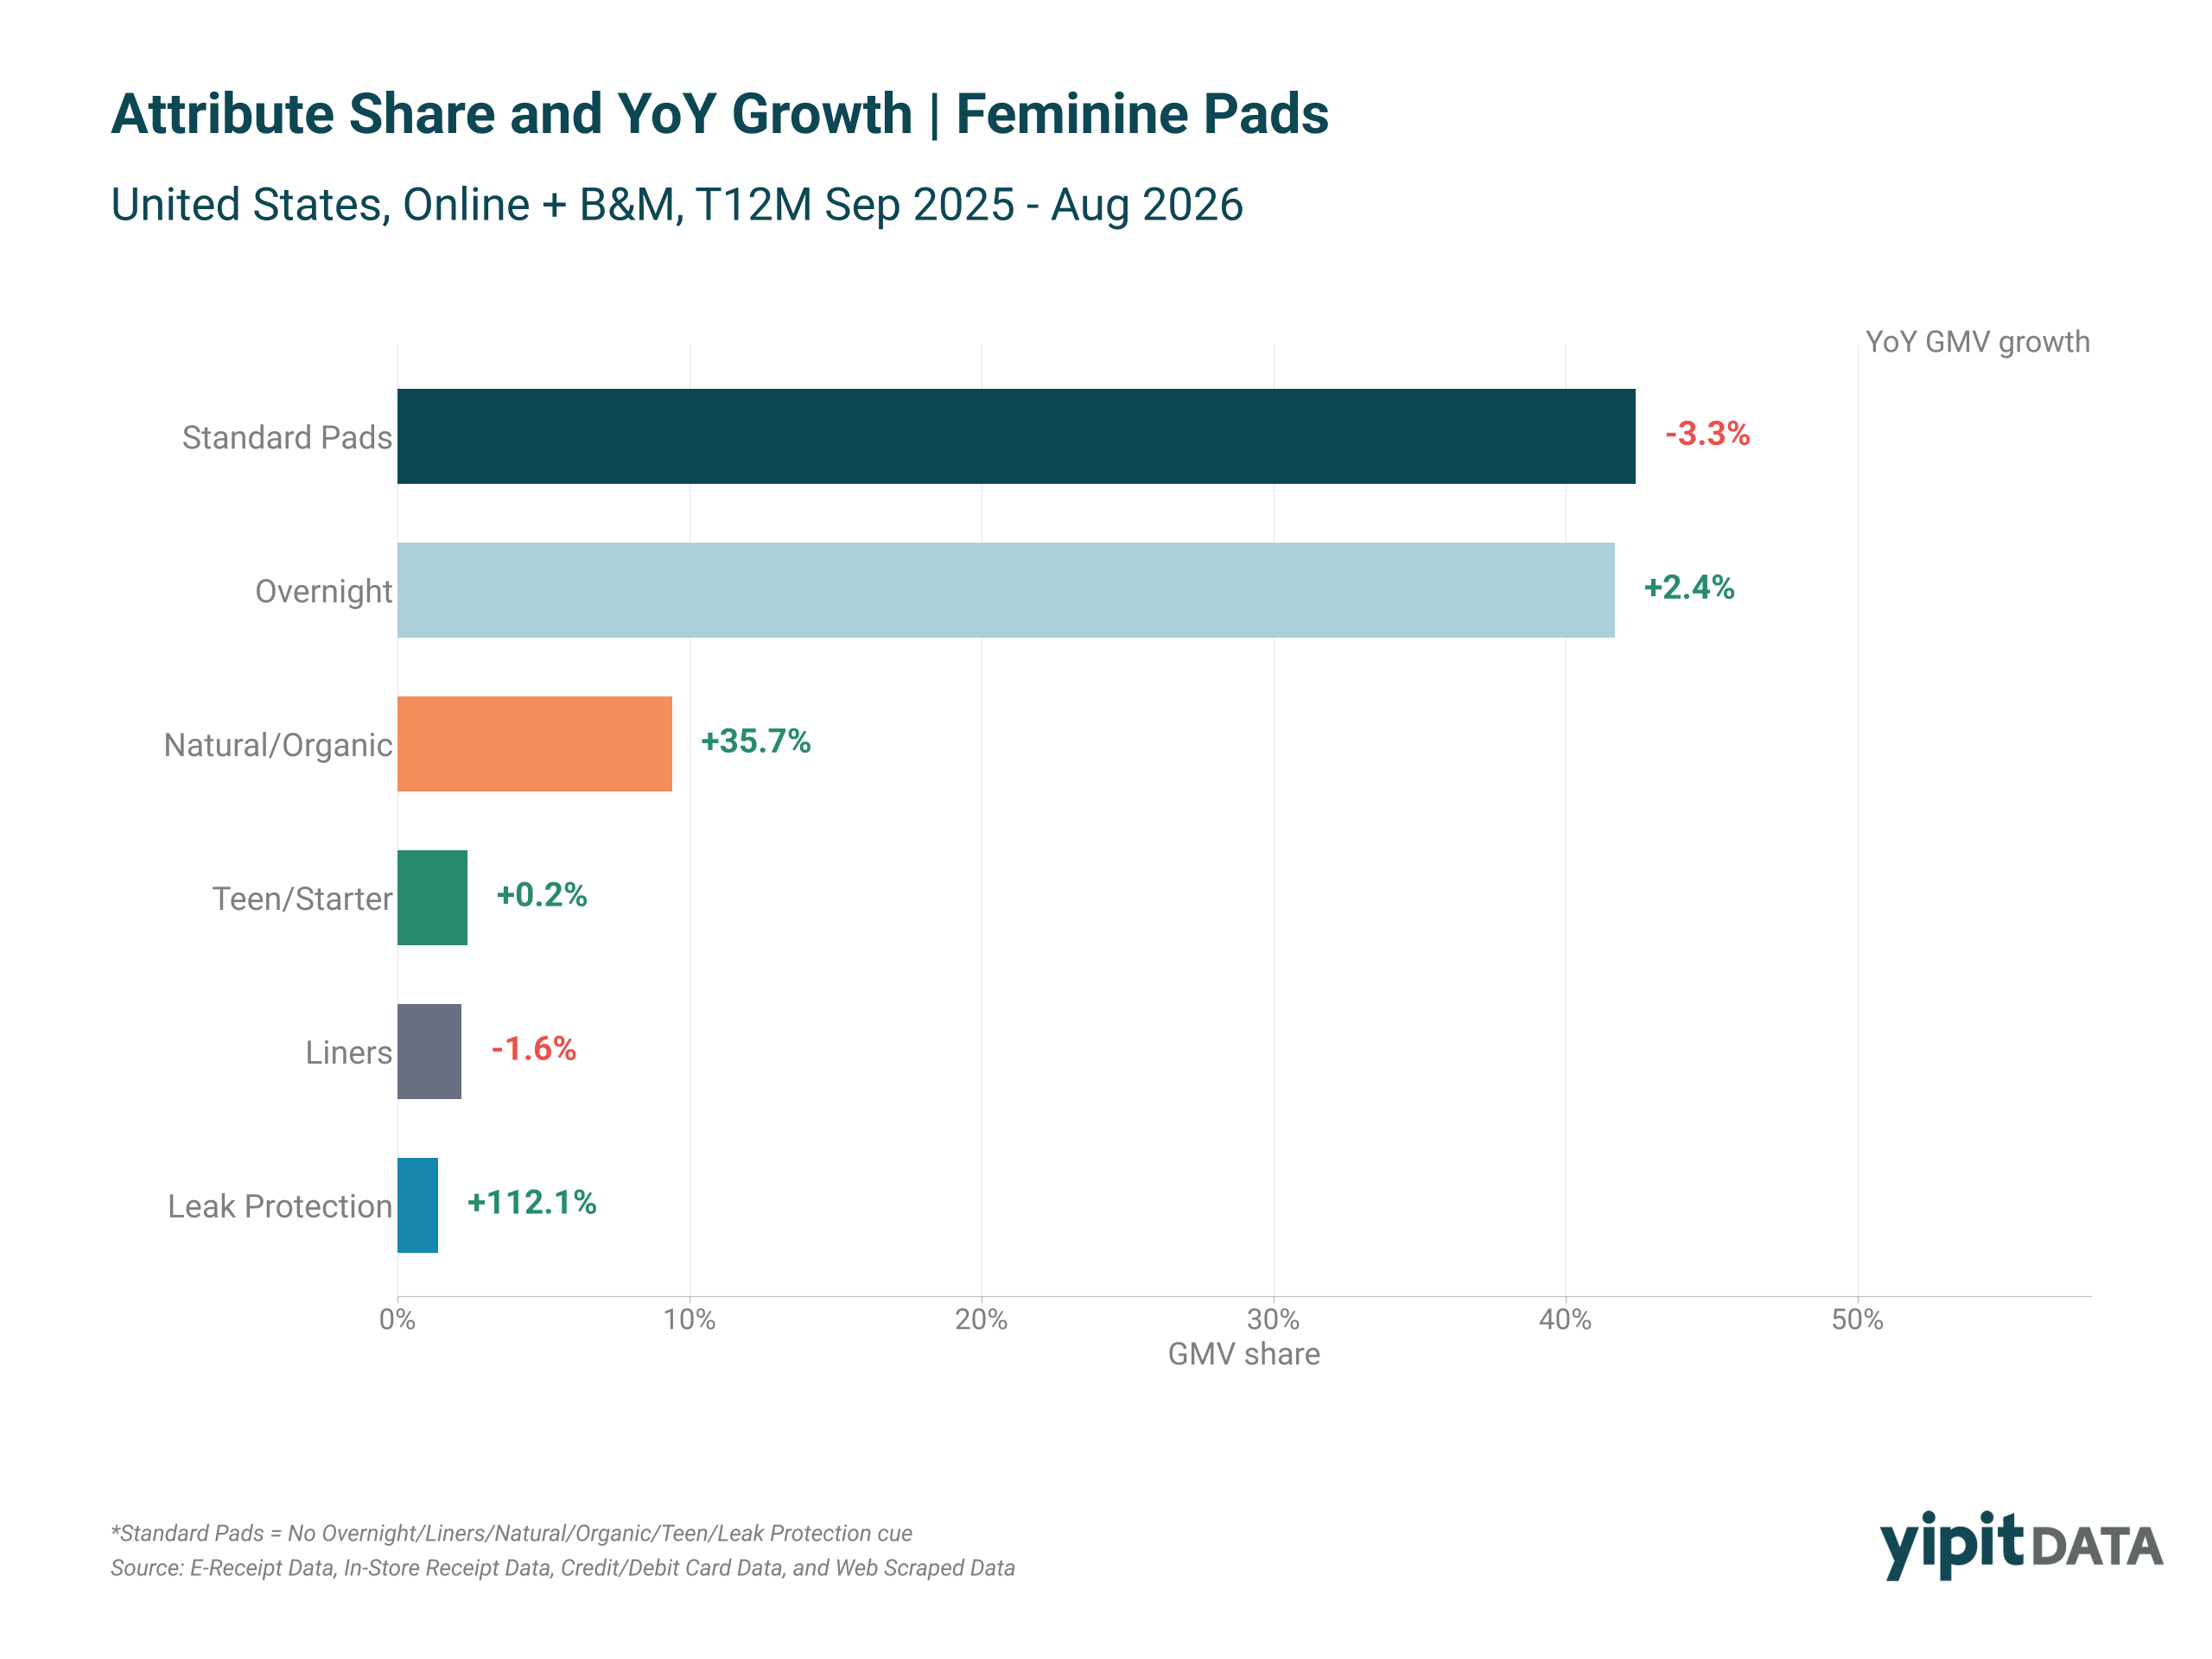
Within the big two, the split is telling. Overnight, a pad with a defined use case and a clear benefit, grew while undifferentiated standard pads (defined here as products with no overnight, liner, natural/organic, teen or leak-protection cue) lost dollars. Teen/starter pads were essentially flat at +0.2% and liners slipped 1.6%.
The fastest growth is in the segments with an explicit benefit, and they are still growing from bases small enough that share can move quickly. Natural/organic in particular is large enough to matter and still growing at more than ten times the pace of pads overall.
Which retailers are gaining share in feminine care?
Amazon. In the expanded market (feminine care plus women’s health supplements), Amazon’s first-party share rose from 7.7% to 11.0% between the twelve months ending January 2024 and the twelve months ending August 2026 (a longer window than the year-over-year pad analysis below), a gain of 3.3pp, while Amazon’s third-party marketplace rose from 7.5% to 11.4%, a gain of 3.9pp. Walmart remains the largest individual retailer, so mass retail has not lost its role. But share is spreading across mass, digital and drug rather than concentrating among a few large accounts.
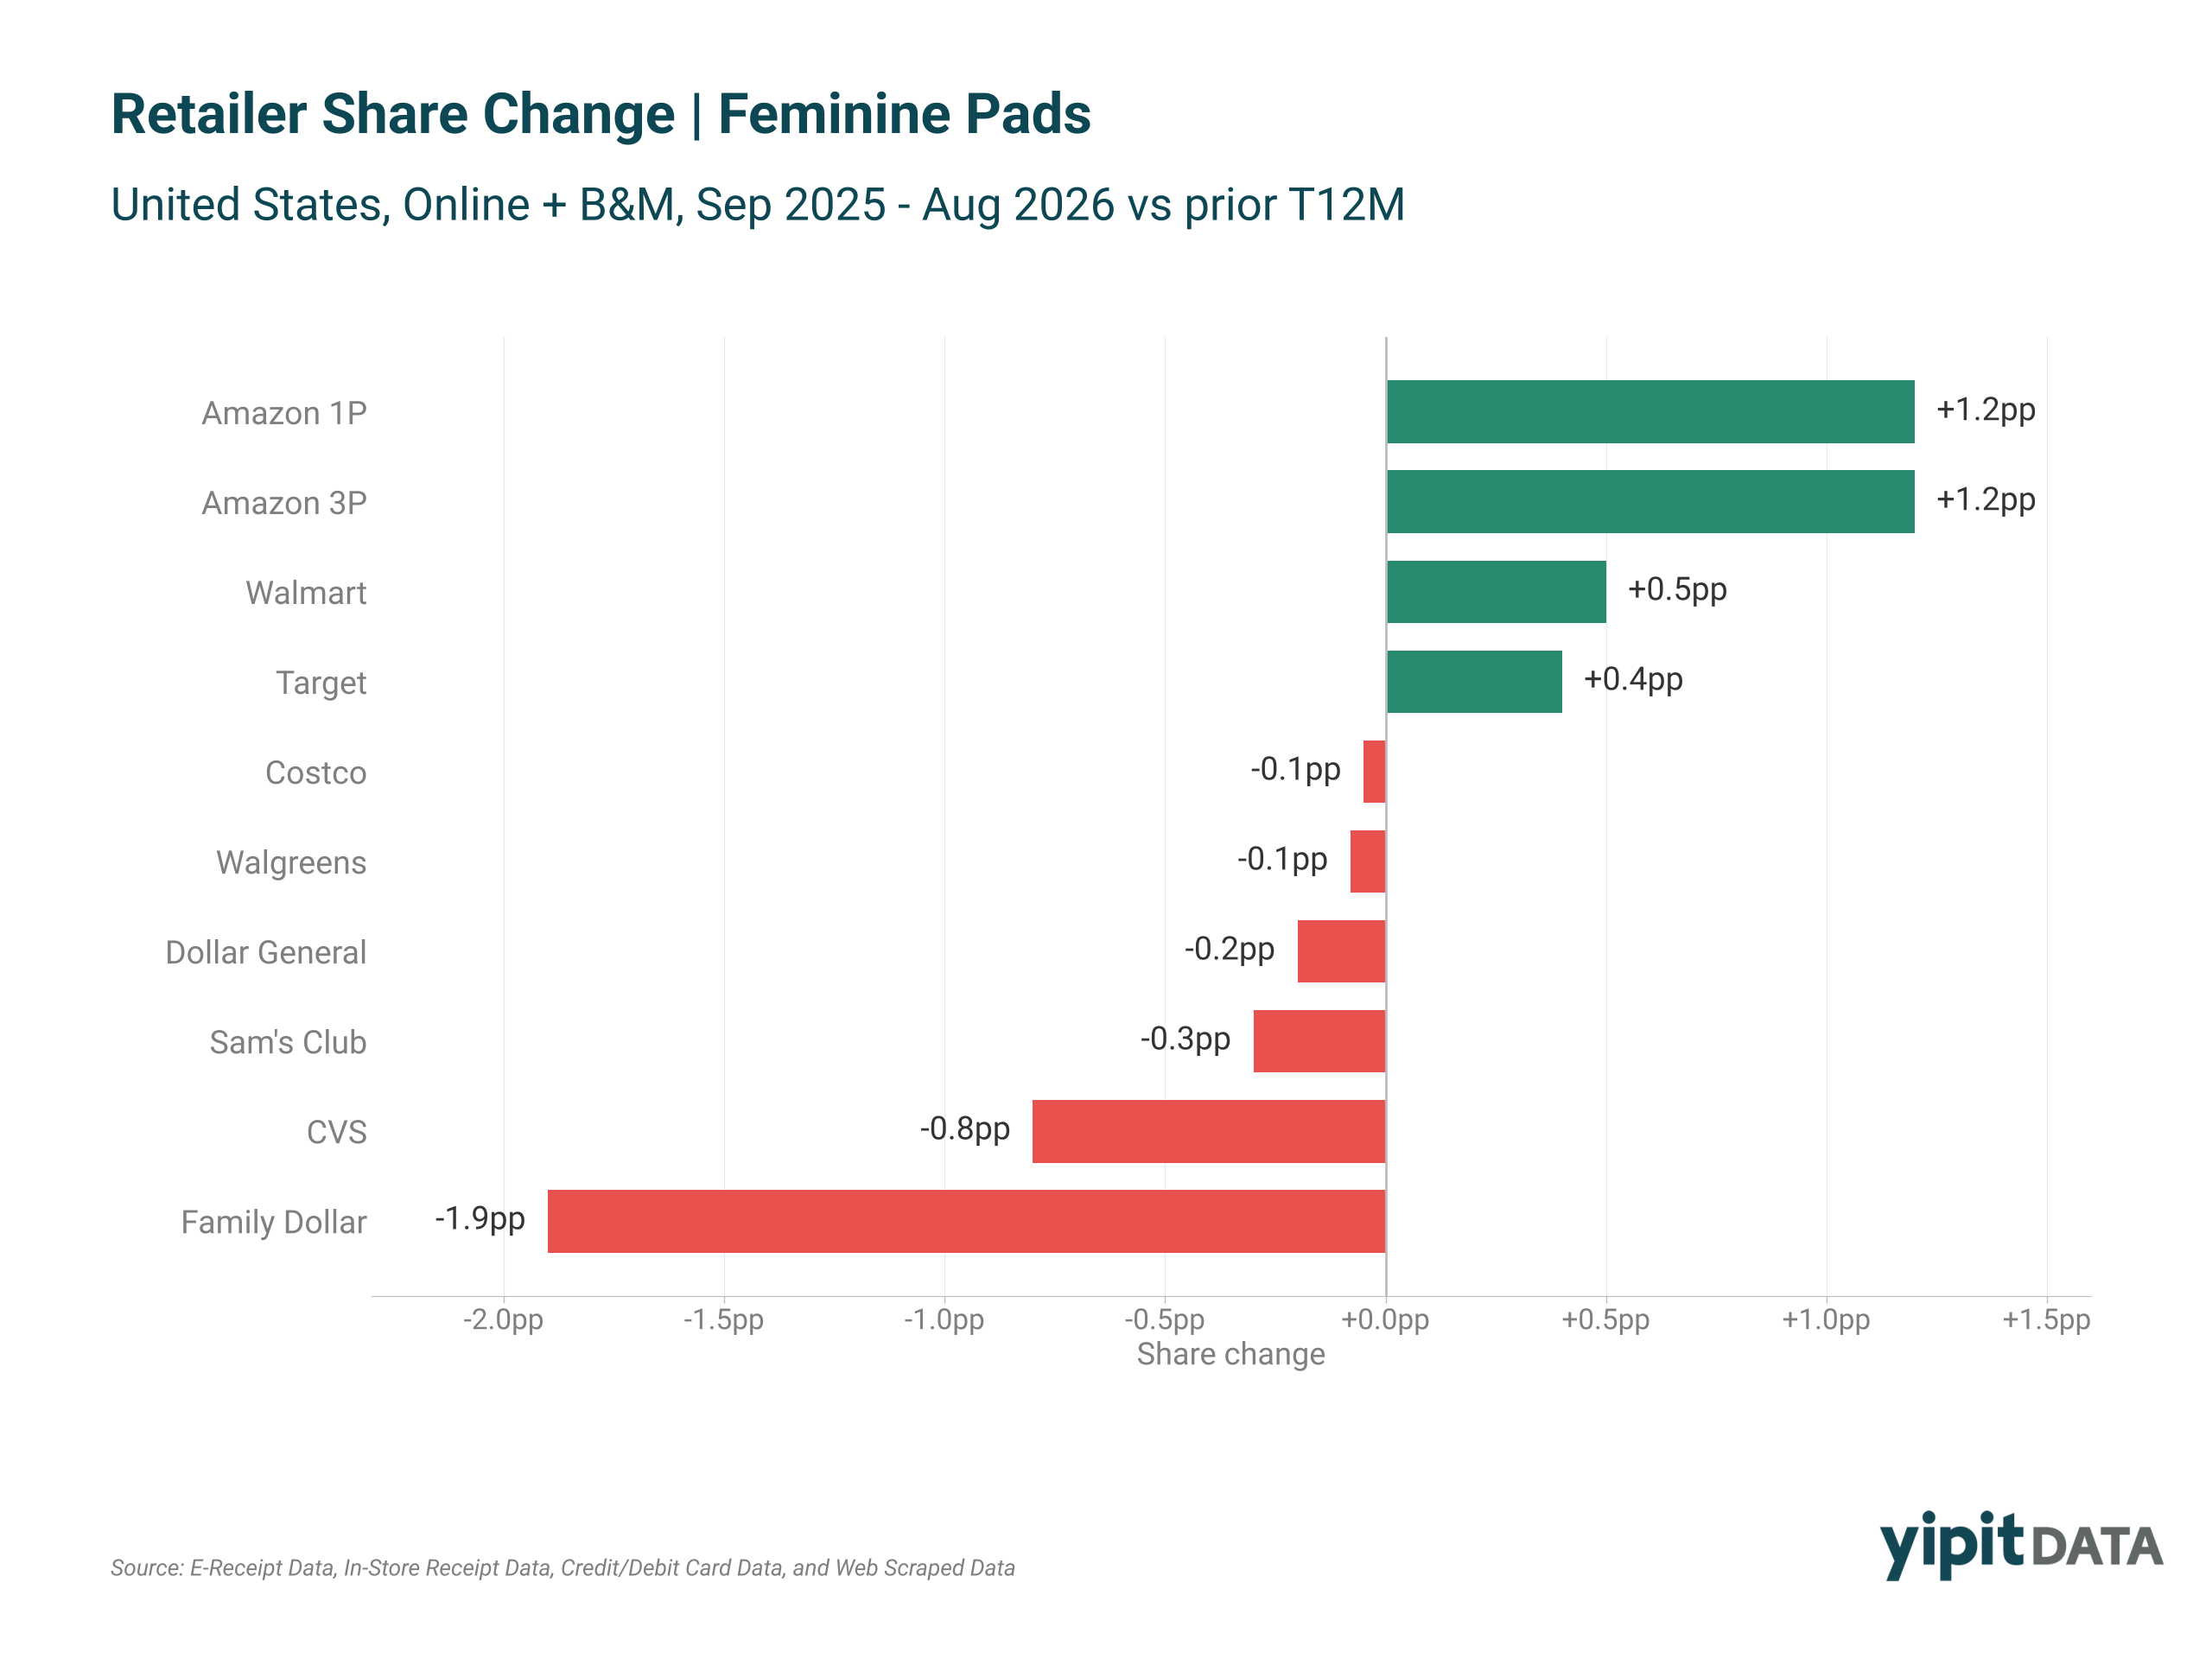
In pads specifically, the share shifts over the last twelve months are sharper and more clearly defined. Amazon 1P and Amazon 3P each gained 1.2pp of pad share, with Amazon 3P GMV growing 45.6%, the fastest-growing route to purchase in the data. Walmart and Target also gained, 0.5 and 0.4pp respectively, and together still hold 42.9% of pad GMV. Dollar and drug retailers lost ground: Family Dollar lost 1.9pp, CVS 0.8, Sam’s Club 0.3 and Dollar General 0.2, while Costco and Walgreens were roughly flat.
Repeat behavior reinforces the channel picture. Pads carry a 52.4% repeat buyer rate overall, and Amazon 1P and 3P both outperform several drug and club retailers on repeat.
Which pad brands are gaining share?
Always remains the clear category leader at 60.9% of pad GMV, and it lost only 0.2pp of share. The movement is happening among the challengers behind it: Honey Pot (+0.9pp), Cora (+0.8pp), Rael (+0.7pp), L. (+0.5pp) and Stayfree (+0.5pp) all gained, while Kotex (−0.3pp), CVS (−0.2pp) and Breeze (−0.2pp) gave share up.
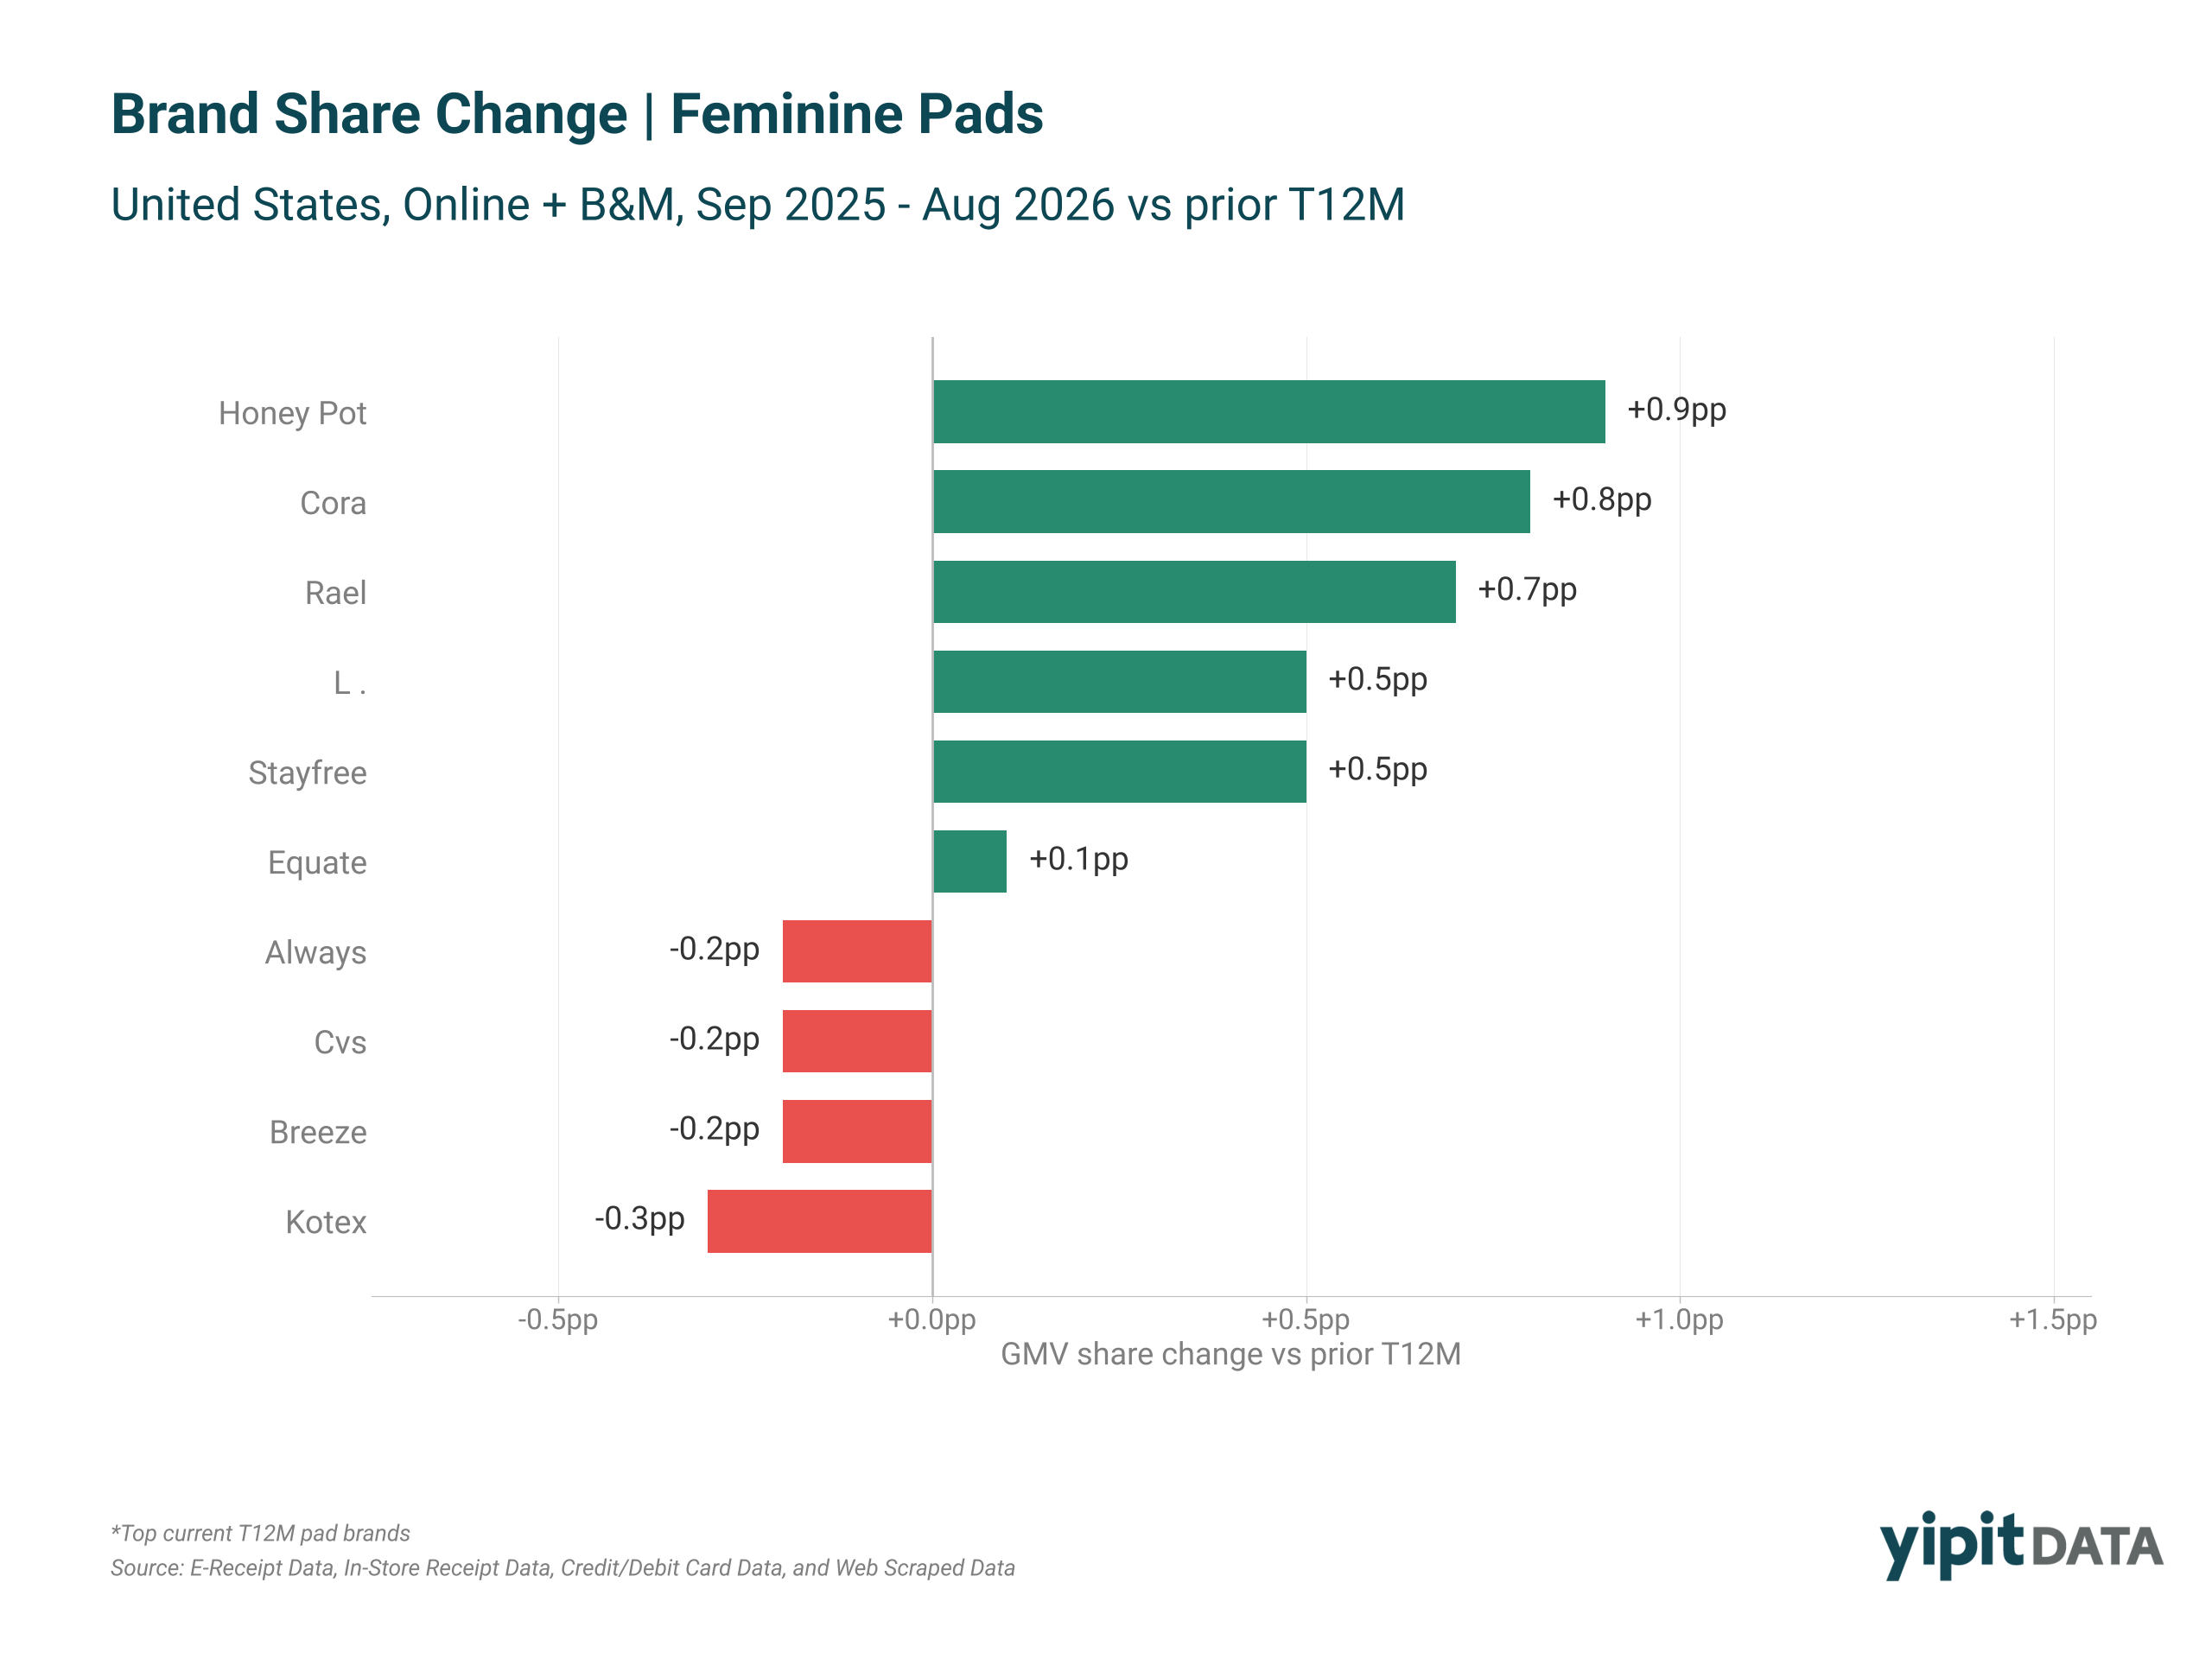
Two things stand out. First, the gainers’ momentum is tied to natural/organic and overnight products, the same attributes growing fastest at segment level. Second, share is fragmenting rather than transferring: no single challenger is emerging as a second major, but five of them are each taking half a point or more. Honey Pot’s gains are notable for being spread across Amazon 3P, Walmart and Target, which suggests a brand scaling in both the digital and mass channels at once rather than relying on one.
Who buys pads, and what else is in the basket?
Pad buyers skew toward lower- and middle-income households. Against the feminine sanitary category benchmark of 100, pads index at 107 among shoppers earning under $25K and 106 among those earning $25K to $50K, declining steadily to 102 in the $75K to $100K band. Above $100K the index falls below the benchmark: 98 for $100K to $150K, 93 for $150K to $200K, and 88 for households earning $200K or more.
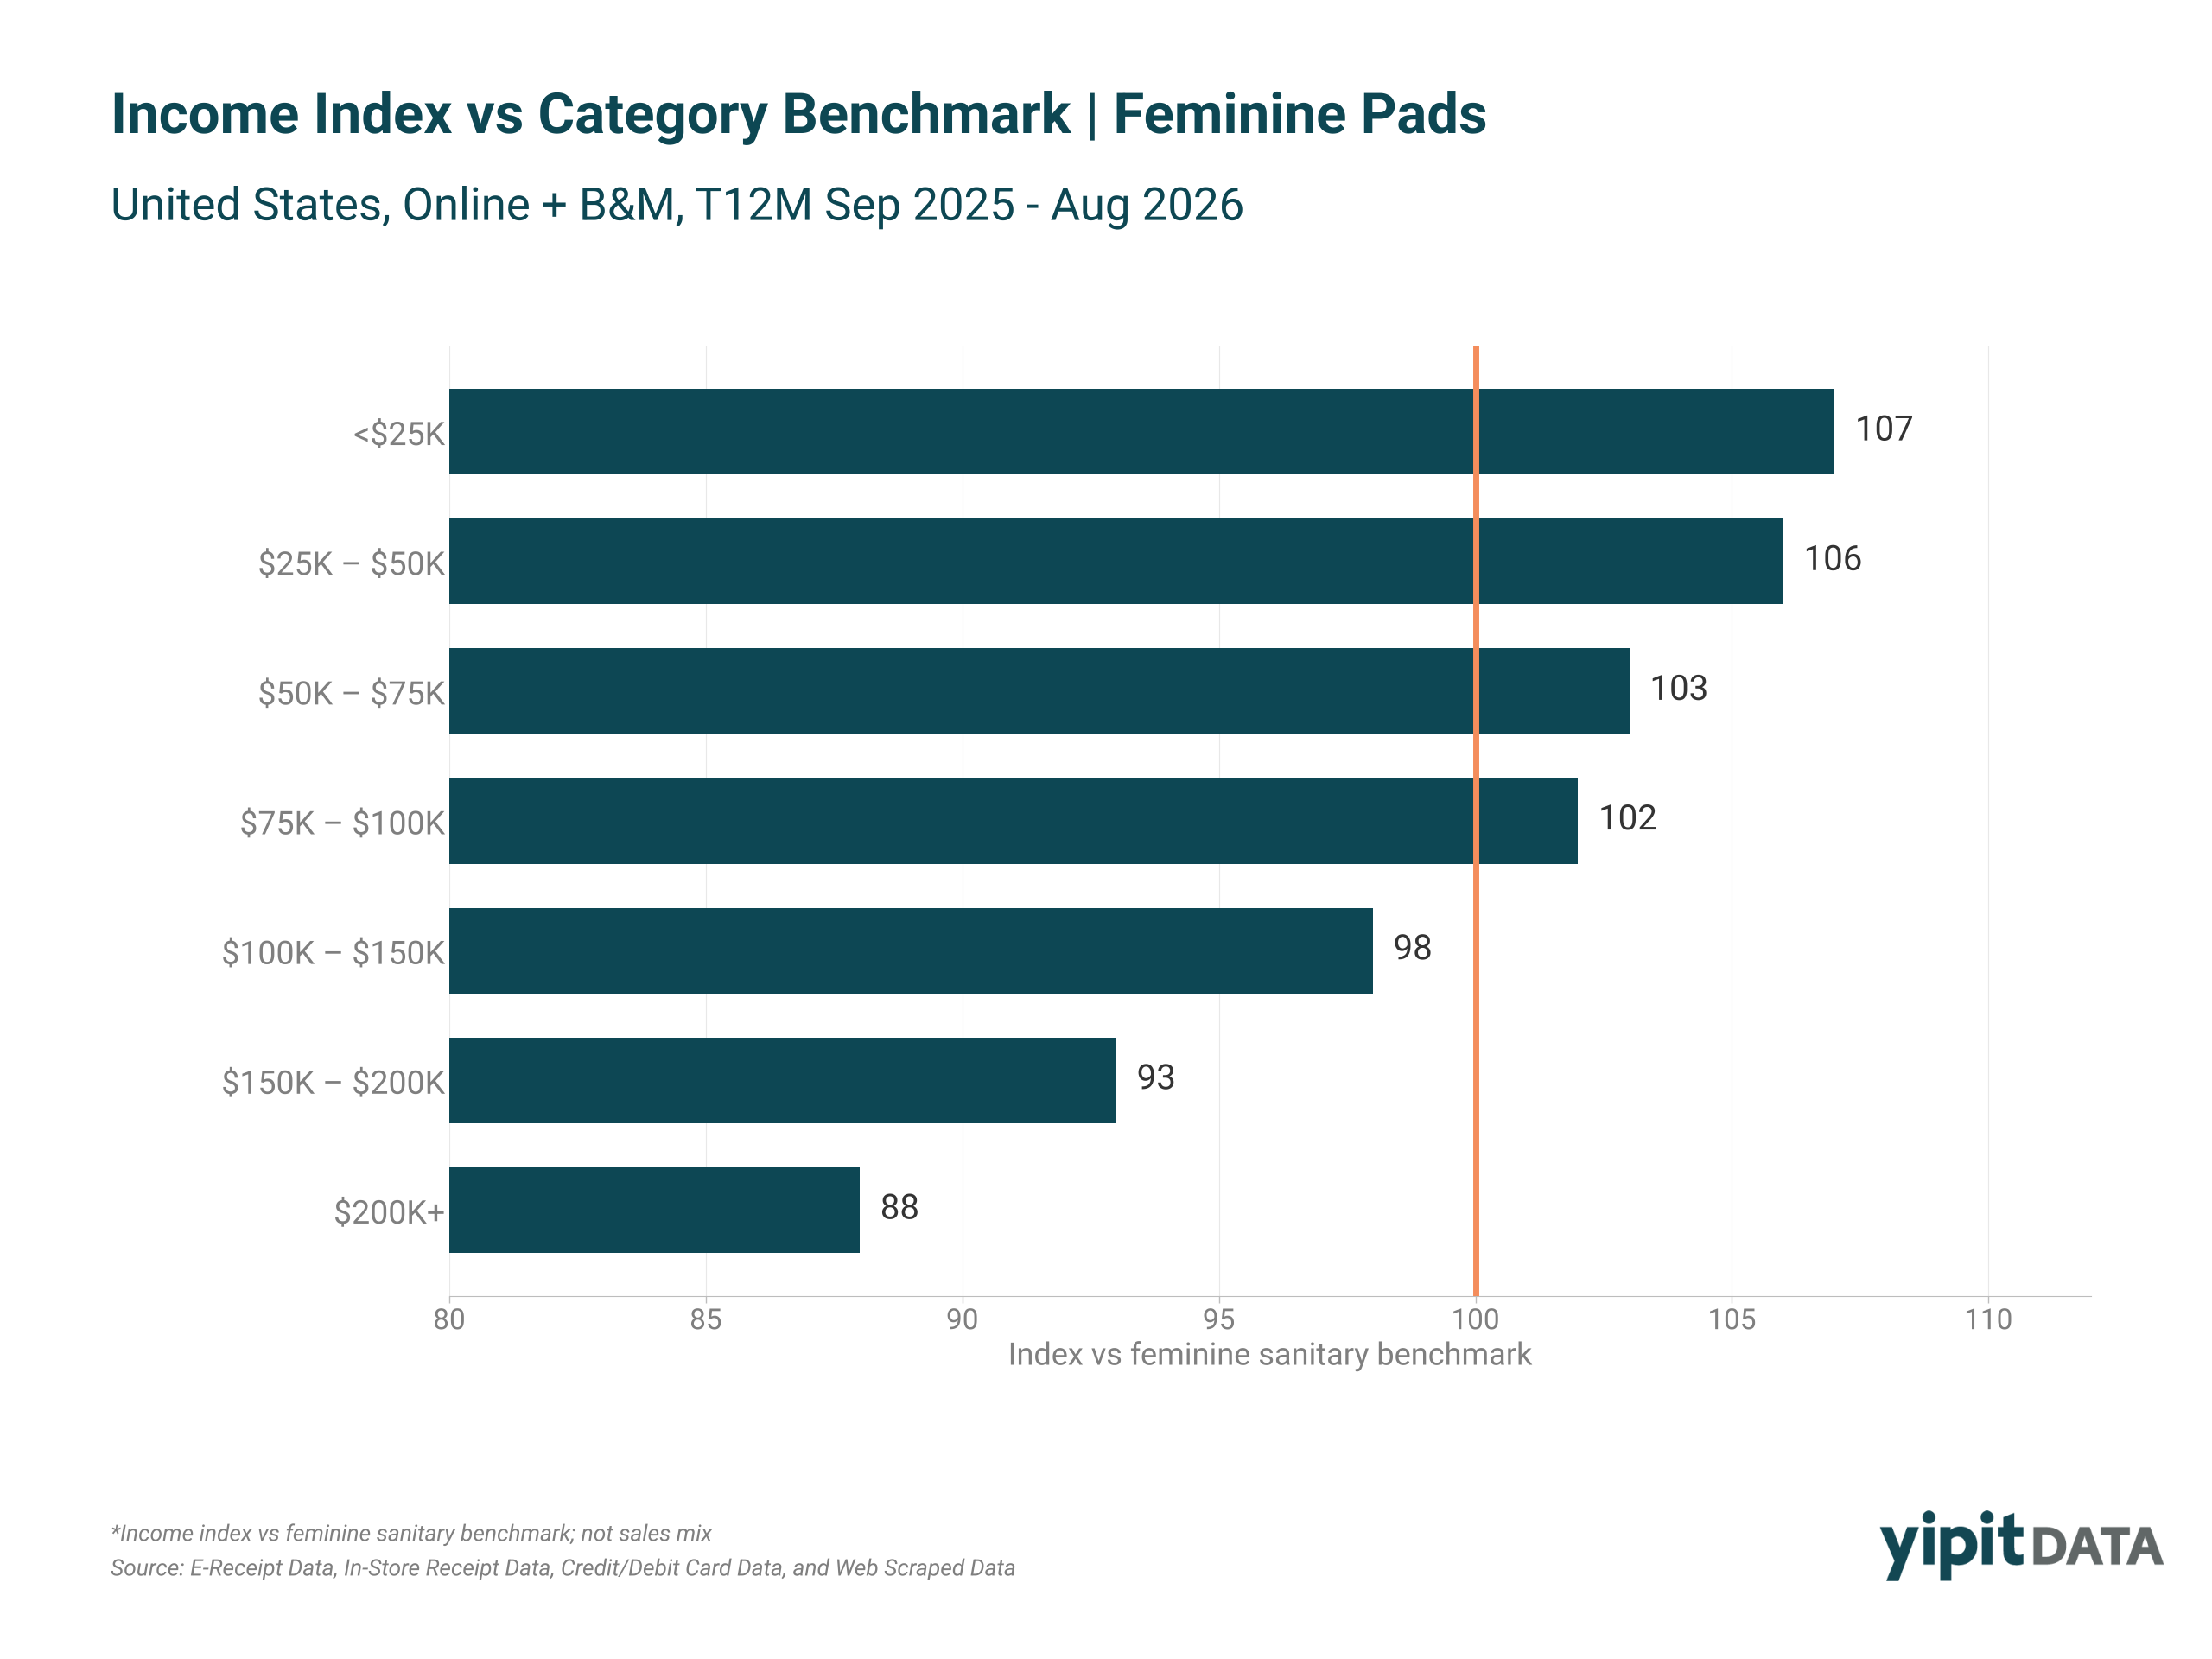
Income in this dataset is an unadjusted demographic shown as an index rather than a sales mix, so the chart describes relative skew, not where the dollars are. This points to a value-oriented consumer base, which is relevant context for a segment where average selling price rose 7.9% while units fell 4.7%. The data does not establish why units declined.
The basket data points to where cross-category opportunity sits. The categories most frequently attached to pad orders are body cleansers, deodorant and antiperspirant, tampons, shampoo and conditioner, and pain relief, followed by toothpaste, body lotion and moisturizers, and hair styling. Pads behave less like an isolated monthly purchase and more like a line item in a broader personal-care routine, which is relevant to anyone planning adjacencies, bundles or promotional pairings.
Methodology
This research is based on YipitData’s consumer transaction data, including e-receipt data, in-store receipt data, credit/debit card data, and web-scraped retailer data. This analysis covers the United States feminine care and women’s health supplements categories across online and brick-and-mortar retail channels for the trailing 12 months through August 2026, compared with the prior 12 months. Retailer share for the expanded category compares the trailing 12 months ending January 2024 with the trailing 12 months ending August 2026. The pad analysis covers feminine pads only, Amazon is reported as first-party (1P) and third-party (3P) separately, and household income is shown as an index against the feminine sanitary benchmark.
YipitData provides near real-time consumer transaction data and analytics across retail, consumer goods, and e-commerce. For more insights on consumer health and wellness trends, brand performance, and category-level spending analysis, visit yipitdata.com.
Frequently Asked Questions
How much is the US feminine care market worth in 2026?
$3.6B in GMV across feminine sanitary supplies and women’s health supplements for the twelve months ending August 2026, up 4.3% from $3.4B the year before, according to YipitData transaction data covering online and brick-and-mortar retail.
Is the feminine care market growing because people are buying more?
No. Unit volume fell 3.9% over the period. Higher average selling prices (+8.5% to $9.02) and mix offset the unit decline; the analysis does not separate pricing from mix effects.
What share of pad sales does Always have?
Always holds 60.9% of US feminine pad GMV in the twelve months ending August 2026, down 0.2pp year over year. The largest challenger gainers were Honey Pot (+0.9pp), Cora (+0.8pp) and Rael (+0.7pp).
Which retailer sells the most feminine care products?
Walmart remains the largest individual retailer in the category. Amazon is the fastest-growing: its first-party and third-party businesses each reached roughly 11% of the tracked feminine care and women’s health supplements market (T12M ending August 2026 vs T12M ending January 2024) and each gained 1.2pp of pad share over the last year.


