Summer 2026 Outdoor Toy Market: Water Play Equipment Growth & Retailer Share


.png)
New product launches are reshaping the water play toy market, with Water Play Equipment sales growing far faster than adjacent categories this summer. This research article breaks down where that growth is coming from, which retailer holds the largest share of the category, and how brand share on Amazon has shifted in recent months. Read on for a data driven look at water play toy sales trends, retailer share, and brand performance heading into next season.
Key Takeaways
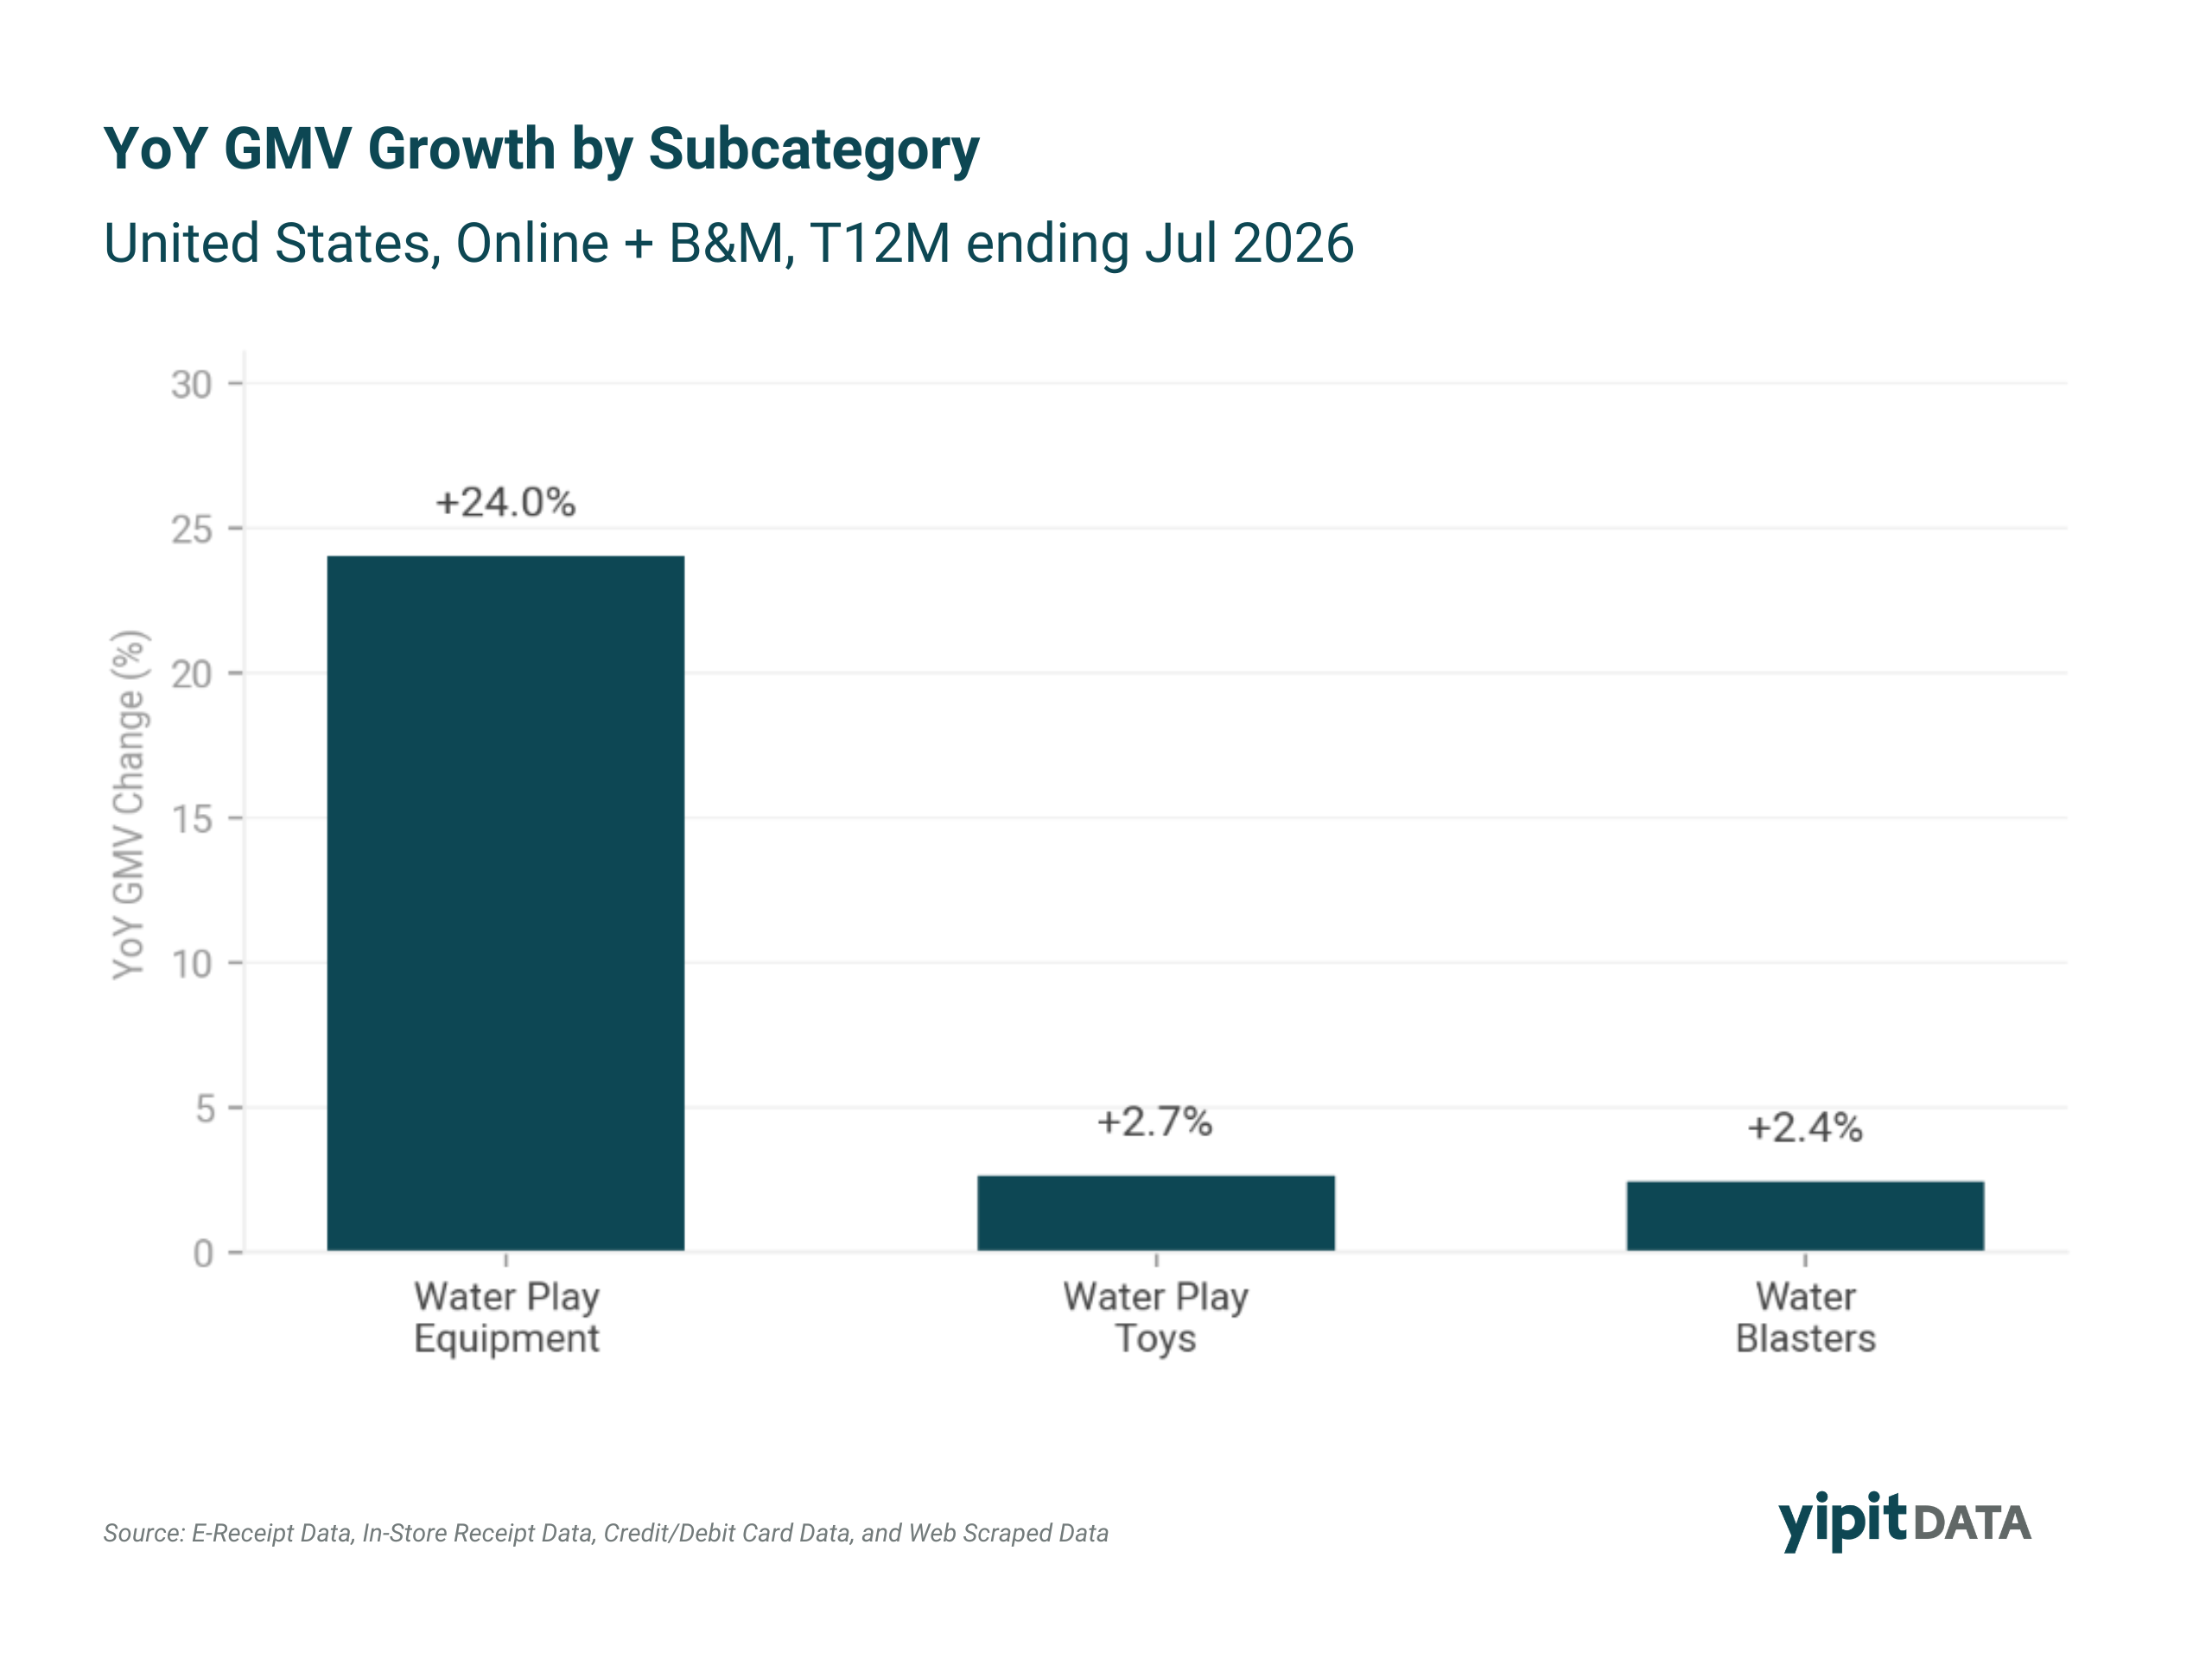
- Water Play Equipment posted 24.0% YoY GMV growth in the T12M ending July 2026, roughly ten times the growth rate of Water Play Toys (2.7%) and Water Blasters (2.4%).
- Amazon held 53.9% retailer share of Water Play Equipment in the T12M ending July 2026, more than double Walmart's share in the category.
- Step2 remained the leading Water Play Equipment brand on Amazon at 17.1% T12M share, though its share is down 3ppt since March 2026.
- Water Play Toys were the most common attachment to Amazon Water Play Equipment orders, appearing in 5.0% of orders, more than five times the rate of any other attached category.
Water Play Equipment Leads Outdoor Toy Category Growth
Water Play Equipment generated 24.0% YoY GMV growth in the P12M (T12M ending July 2026) compared to the prior T12M, driven primarily by new product launches. Water Play Toys and Water Blasters posted comparable growth rates of 2.7% and 2.4%, respectively, roughly a tenfold difference relative to Water Play Equipment. The gap suggests that new product introductions, rather than category wide demand, are the primary driver of water play toy sales growth this year.
Amazon Holds the Largest Retailer Share Across Water Play Categories
Amazon held the leading retailer share across all three water play categories in the P12M (T12M ending July 2026), capturing 53.9% of Water Play Equipment, 43.3% of Water Play Toys, and 32.2% of Water Blasters (Amazon share includes Amazon 1P and 3P). Walmart followed as the second largest retailer in each category, ranging between 13.0% and 24.1% share. For retailers and brands evaluating where to prioritize distribution and merchandising investment, this data indicates Amazon remains the primary sales channel for water play toys.
.png)
Step2 Leads Amazon Water Play Equipment Brand Share, Though Share Has Softened
Step2 remained the leading brand within Water Play Equipment on Amazon at 17.1% T12M share as of July 2026, down 3ppt since March 2026 (20.9% to 17.1%). Intex held a steady second place, ranging between 6.0% and 6.6% share. Among smaller brands, Starocean posted the largest share gain at 1.2ppt, while Wellfuntime, Herokiddo, and Springwater each grew by less than 1ppt. The data shows a leading brand still well ahead of competitors, though its share trajectory has moved lower in recent months.
.png)
Water Play Equipment Purchases Extend Into a Broader Active Play Basket
Water Play Toys were the top attachment to Water Play Equipment orders on Amazon at 5.0%, well above the next closest category. Water Blasters followed at 0.9%. Beyond water categories, Dress-up & Roleplay (1.3%), Building & Construction Toys (1.0%), and Bubble Blowing Toys (1.0%) were the most common non-water attachments. This basket composition indicates that Water Play Equipment purchases tend to occur within a broader active play shopping trip rather than as a standalone purchase.
.png)
Step2 and Intex Hold the Top Selling Water Play Equipment Products on Amazon
Step2 holds three of the top five Water Play Equipment products on Amazon, including the top ranked position, while Intex holds the remaining two. Intex Jungle Adventure posted the largest rank change of the group, moving up four positions to the third rank, consistent with the broader brand share gains noted for smaller Water Play Equipment brands.
.png)
What This Means for the Toys Industry
For toy manufacturers, retailers, and investors, this data shows that Water Play Equipment's growth is driven by specific new product launches and brand level share shifts, not broad category demand, that Amazon holds more than half of category sales, and that a leading brand's share can move several ppt in a single season, as seen with Step2's drop from 20.9% to 17.1% since March 2026. Category level headlines can mask this kind of underlying movement, which is why granular, receipt level data like YipitData's e-receipt, in-store receipt, credit and debit card, and web scraped sources is useful for tracking these shifts in near real time.
Methodology
The data in this article is sourced from YipitData's proprietary panel of e-receipt data, in-store receipt data, credit and debit card transaction data, and web scraped retailer data covering the United States toy market. Figures reflect Online and Brick & Mortar (B&M) transactions unless otherwise noted as Amazon specific, growth rates are presented on a year over year (YoY) basis comparing trailing 12 month (T12M) periods ending July 2026 against the prior 12 month period, and retailer and brand share figures represent percentage of category GMV (gross merchandise value) over the stated period, with percentage point (ppt) figures representing the absolute change in share between two periods.
YipitData provides near real-time consumer transaction data and analytics across retail, consumer goods, and e-commerce. For more insights on toy industry trends, brand performance, and category-level spending analysis, visit yipitdata.com.
.svg)
Speak to our Insights team


.svg)