2Q22 Home Goods Index


2Q22 Home Goods Index. Browse YipitData's research library for reports, insights, and data-backed market analysis.
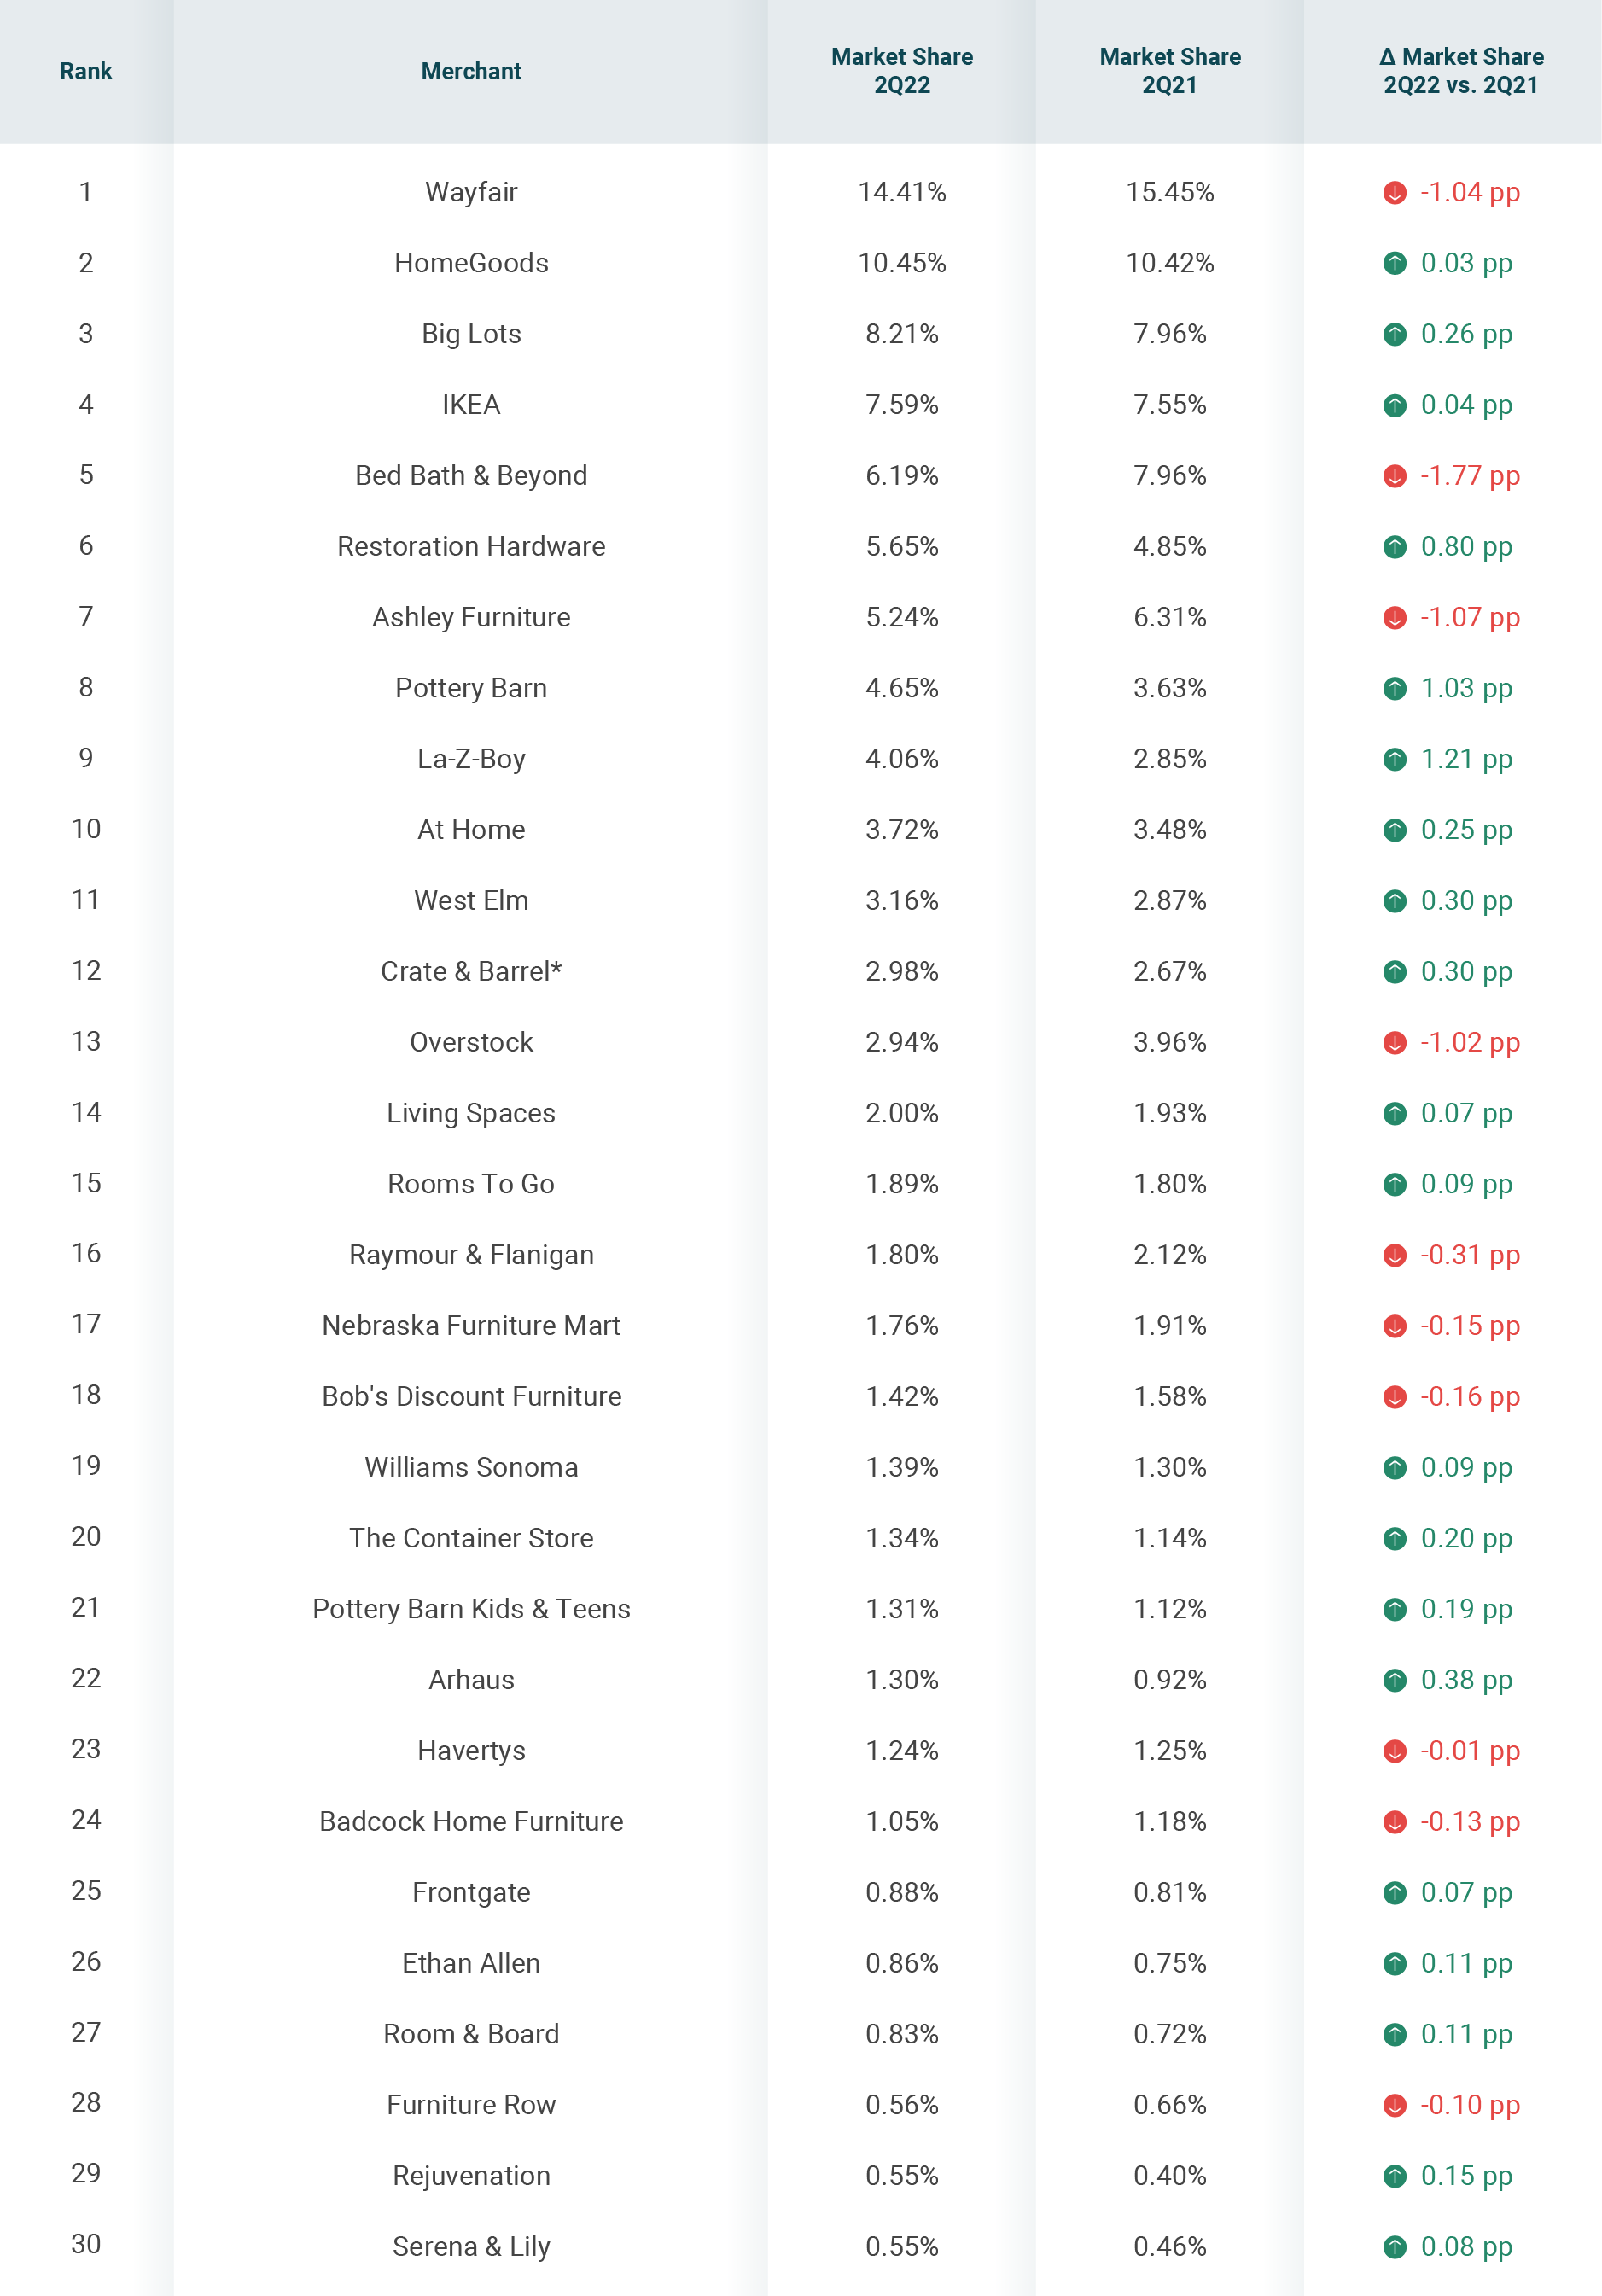
*Crate & Barrel includes CB2 sales
Does not include Amazon, Walmart, Target as this index is focused on the pure play retailers
Source: Transaction data
Published 8/9/22
YipitData helps clients in the home goods space understand market share, sub-category level insights and which mass retailers are taking share or moving offline. Interested in learning more?
Key Questions:
How is the industry faring overall, now that we are 2+ years past the start of the pandemic? Prior to the pandemic, Bed Bath & Beyond was the largest home goods retailer. However it has been unable to keep up momentum and is now the fifth largest retailer, behind Wayfair, HomeGoods, Big Lots, and IKEA.
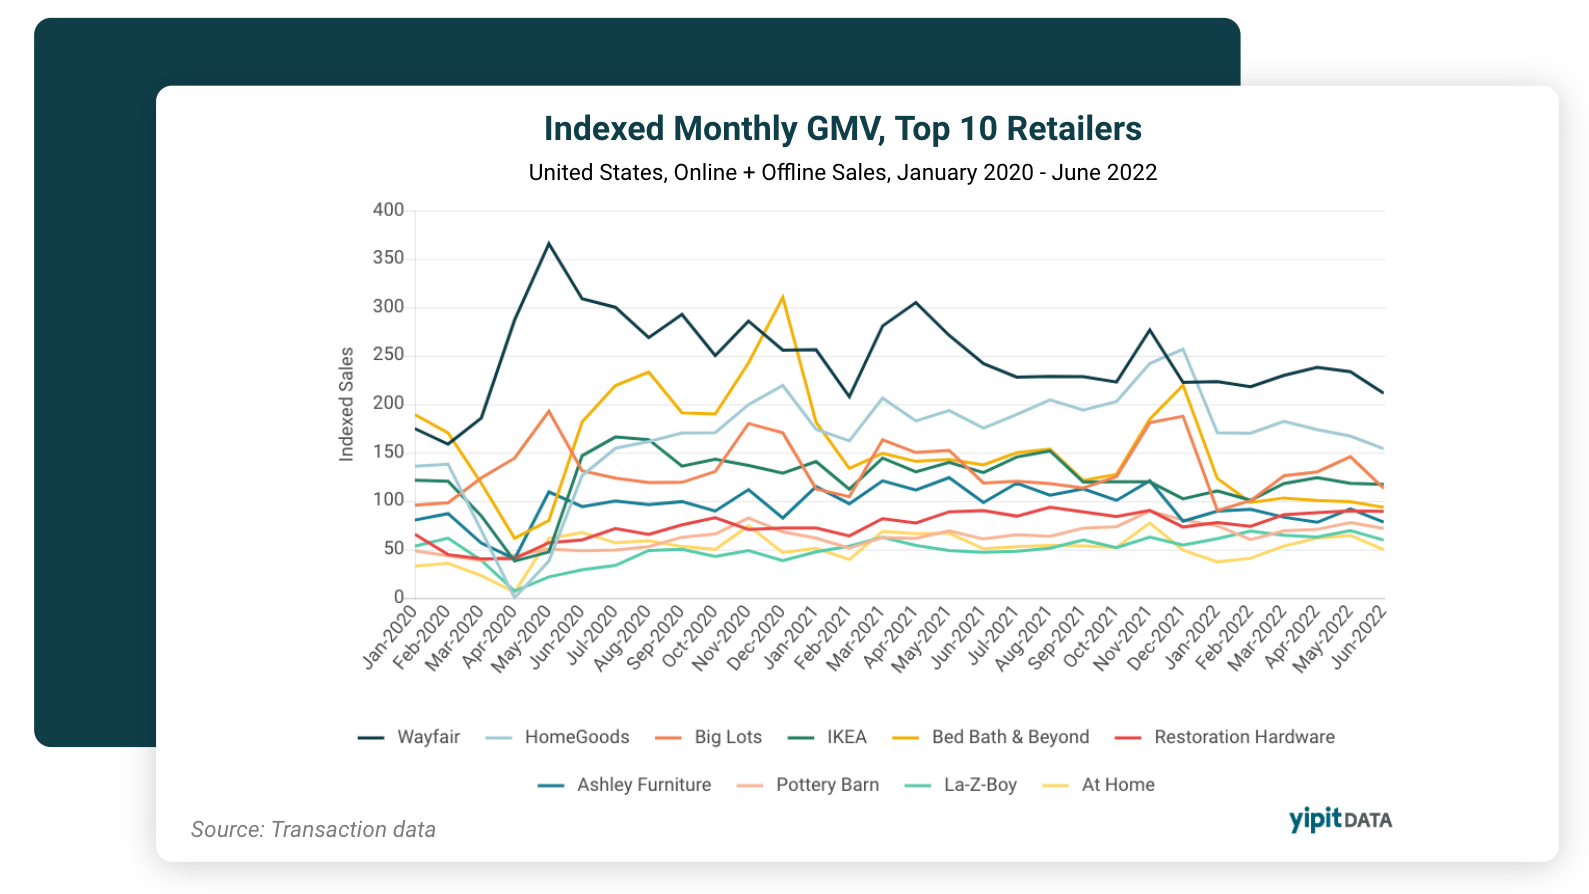
Has demand for home furniture and goods maintained or is it tapering? Monthly GMV for the Top 10 Home Retailers overall has shrunk compared to last year, indicating a noticeable decline in consumer spending on home retail products.
Learn More
Key Questions:
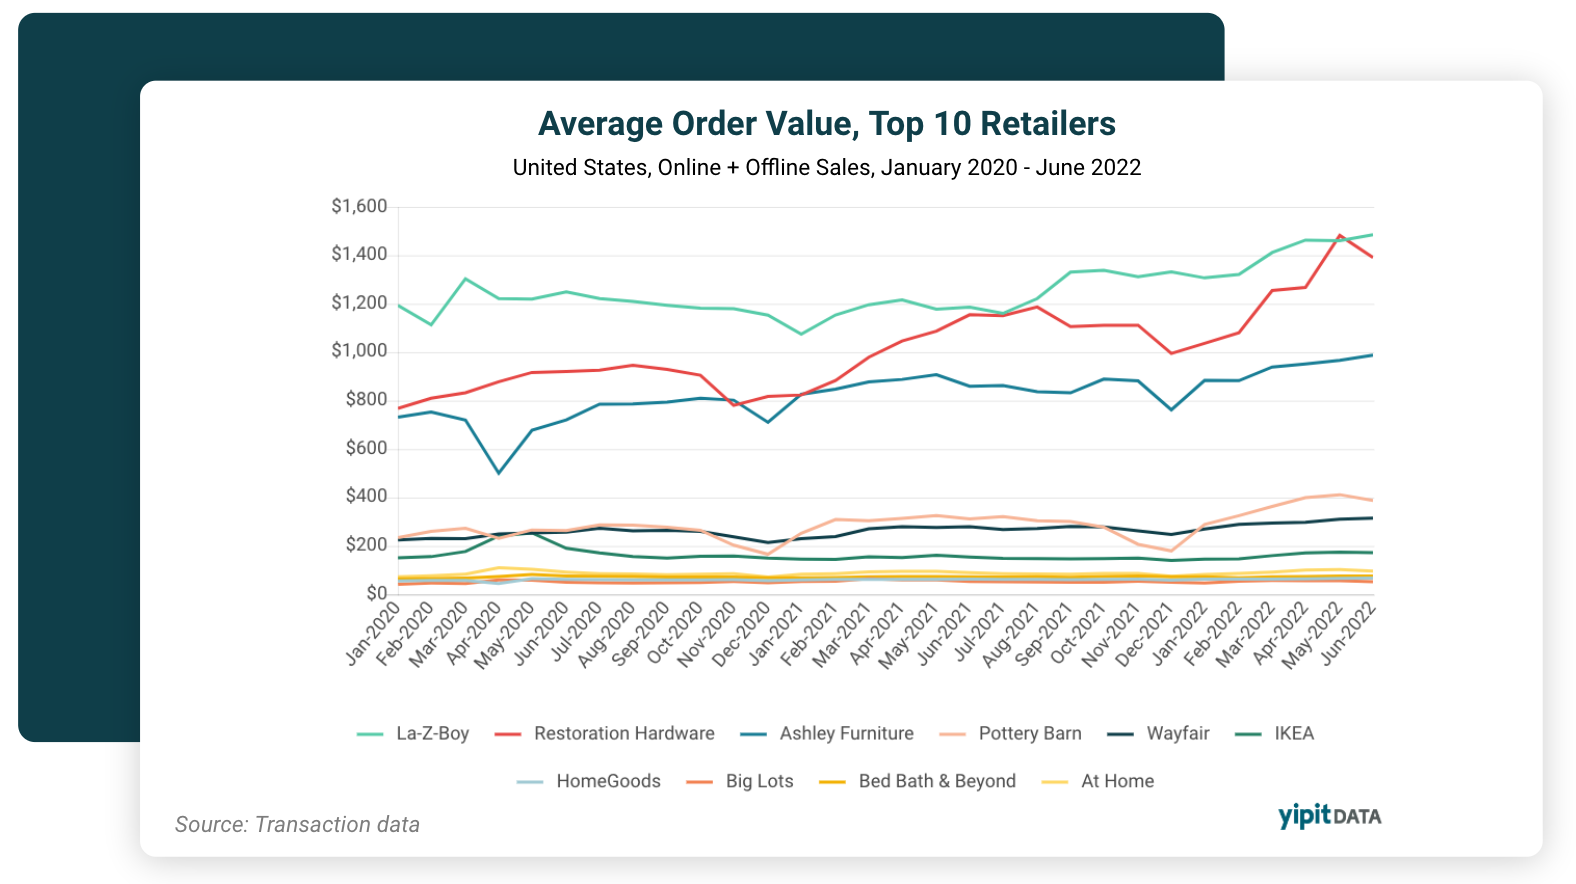
How has consumer spending shifted? With the exception of IKEA, AOVs have increased across the board. As inflationary pressures and costs of goods hit the furniture industry, prices are rising. Restoration Hardware saw a 47% increase in average order value between H1 2020 and H1 2022, its AOV is now over $1,200.
What does average order value look like for me vs. my competitors?
At Home, HomeGoods, Big Lots, and Bed Bath and Beyond sell lower cost goods, with average order value for all four brands consistently under $100.
Learn More
Key Questions:
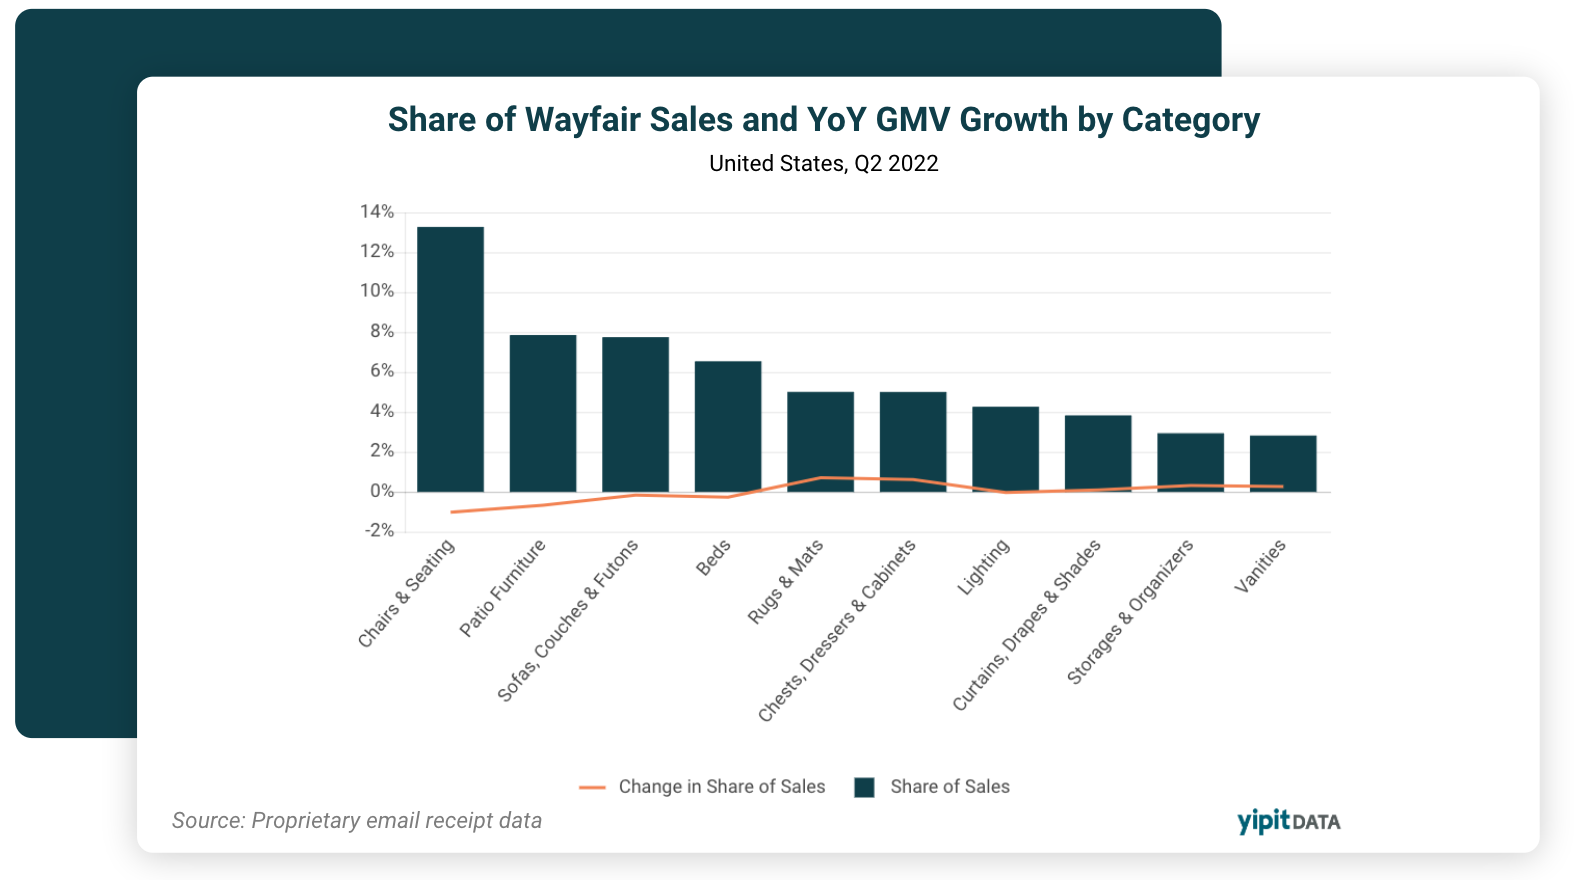
What categories are driving growth for Wayfair? Wayfair’s largest categories have seen the largest declines in share of sales. Chairs & seating share of sales declined 1 percentage point YoY. Patio furniture also experienced a 0.66 percentage point decline in sales
How has category share shifted over time? Rugs & Mats share of sales grew the most (+0.71 pp) and is now the fifth largest category on Wayfair, overtaking Chests, Dressers & Cabinets.
How much share are retailers like Amazon taking? Amazon Home category sees largest boost in sales on Prime Day 2022.
Learn More
About YipitData
YipitData is a trusted data partner for over 480 of the world’s largest investment funds and companies. We answer key questions and enable better business decisions through our data and insights.
Note about index methodology improvements: Since the release of our Q1 2022 report, the Home Goods Market Share Index methodology has been improved with refined coverage of brick-and-mortar transactions for all merchants. Our team analyzes billions of data points from transactions, email receipts, and web data and triangulates that data with publicly released sales estimates to ensure accuracy. This index is representative of online and offline sales within the U.S.
Download the report


.svg)

