Consumers spend more per order at home goods pure players than mass retailers


Consumers spend more per order at home goods pure players than mass retailers. Data-backed consumer insights and market analysis from YipitData's research team.
Average order values (AOV) for pure players in the home market have increased over the year, suggesting either brand-led price hikes or consumers adding more items to their order. On average, between January and October 2022, consumers spent between $150 and $166 at these home specialists and purchased about 1.5 times a month. This frequency was relatively stable throughout the year.
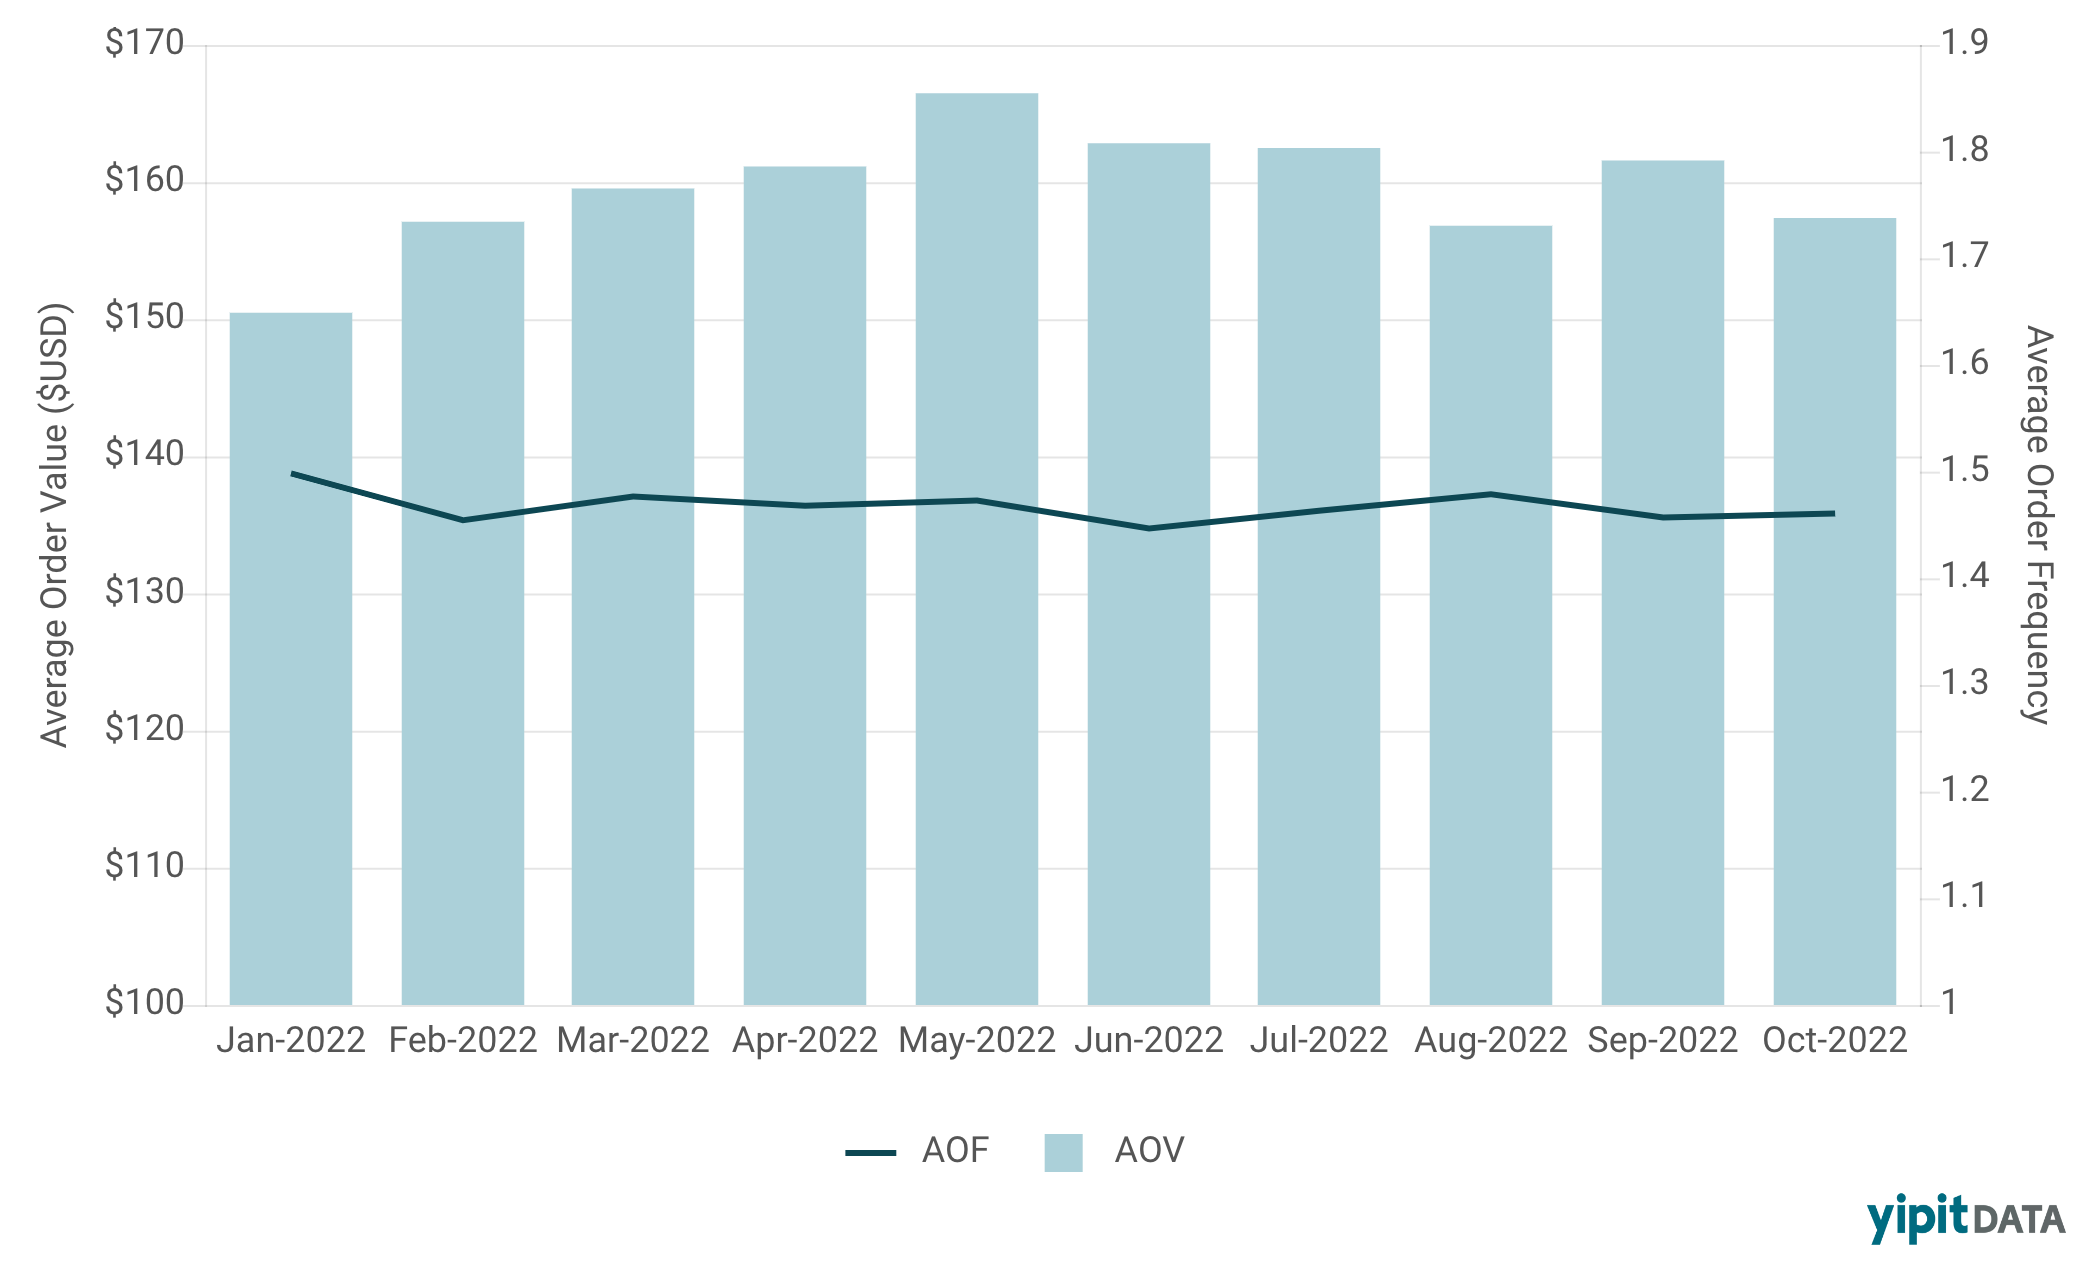
United States, Online + Offline | January 2022 - October 2022
Mass retailers, however, commanded relatively inexpensive consumer baskets in the home category: average selling price (ASP) ranged between $26 and $32 from January to October 2022. ASP in October 2022 was only $28.51, a 8% decrease YoY. This suggests that mass home consumers are generally buying from more inexpensive subcategories – such as decor or sheets – rather than higher-priced furniture.
However, the ordering frequency for consumers buying home goods at mass retailers is consistently higher than for consumers purchasing from home-specific retailers.

United States, Online | January 2022 - October 2022
Sources: Transaction data and email receipt data
Fill out the form to speak with an analyst.
Speak to our Insights team


.svg)

