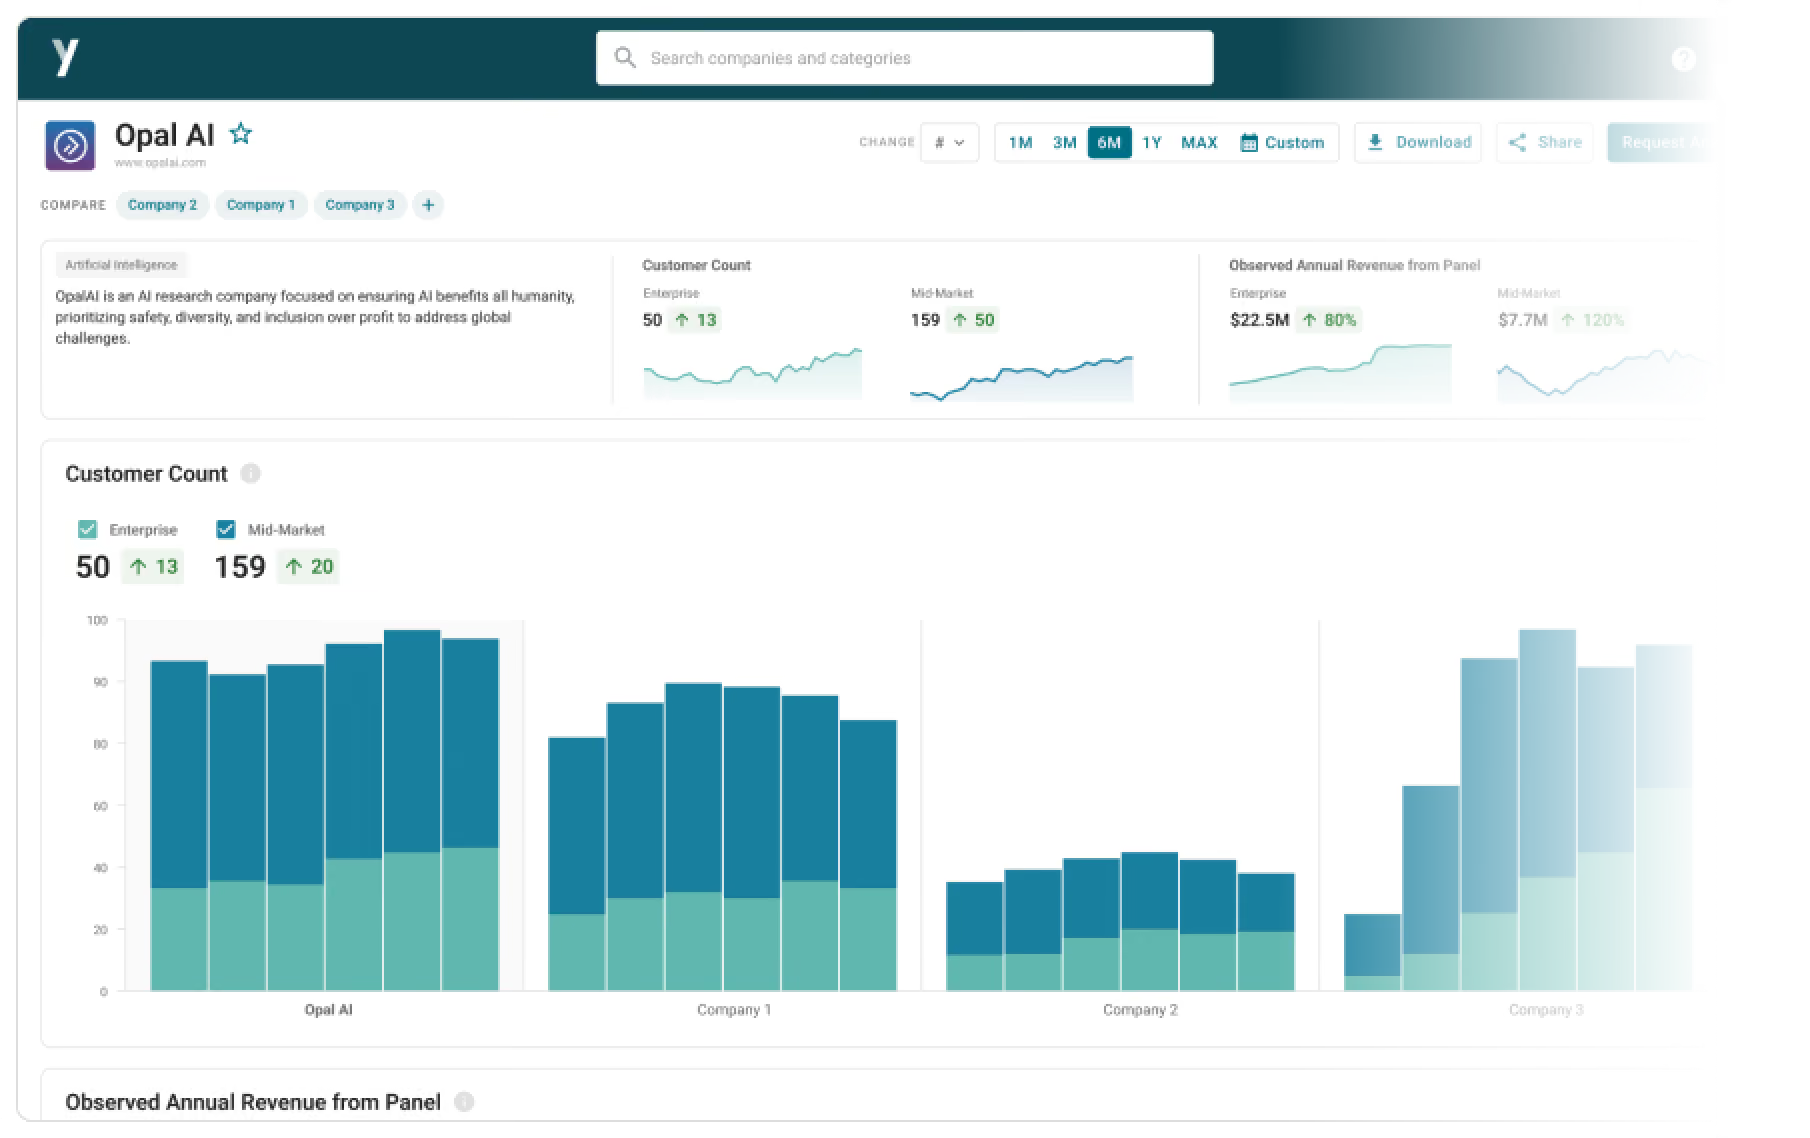
Real spend data on private AI & software companies

Track insights like market share, growth rate, retention, ACV trends, category growth, winners and losers, switching behavior, and more.

What makes our data different?

The data is...
  • Directly from the ERPs of mid-market and enterprise businesses
  • Proprietary (only available with YipitData intel)
  • Updated on a recurring cadence (monthly) for fresh trends
The data is not...
  • Survey responses or self-reported metrics
  • Publicly available (public disclosures or web-scraped)
  • Stagnant or infrequently reported
Headcount data visualization — YipitData alternative data for investors

Stop relying on lagging indicators like headcount data and last funding rounds.

Bar chart showing YipitData market share data trends across retail channels

Get direct visibility to source inflecting companies and benchmark competitors.

Unlock real data points across 250K+ private companies.

Join our newsletter to track breakout AI & software companies — before the market does!

Get weekly breakout indicators on 250K companies, including real-time ACV data.

Bringing the public market approach to the private investor

YipitData market share charts showing competitive brand performance by retailer

Access B2B spend data on target companies and their closest peers/competitors. Easily compare market share, growth, ACVs, retention rates, and switching behavior to walk into the boardroom with confidence and invest with conviction.

Are they #1 because they’re better or because they’re cheaper?
Track ACV trends vs peers.
Is there room to grow in the category?
Spot high-growth potential vs saturated categories.
Who’s #1 in the category? Who is applying pressure?
Identify rising and declining AI and SaaS leaders within their category.

More insights

No items found.

Want to see how it works?

Trial the platform