
Channel Splits
Market share breakdown by online vs. brick & mortar
Category Insights
Sales at sub-category level
Low-Latency
Data delivered 7–10 days after end of month
Proven Accuracy
Panel with 21mm monthly active users
A near real-time view of total top-line revenue at leading home goods retailers.
Category-level sales for select retailers of your choice, including Walmart, Target, Wayfair, and Home Depot.


Market share breakdown by online vs. brick & mortar
Sales at sub-category level
Data delivered 7–10 days after end of month
Panel with 21mm monthly active users
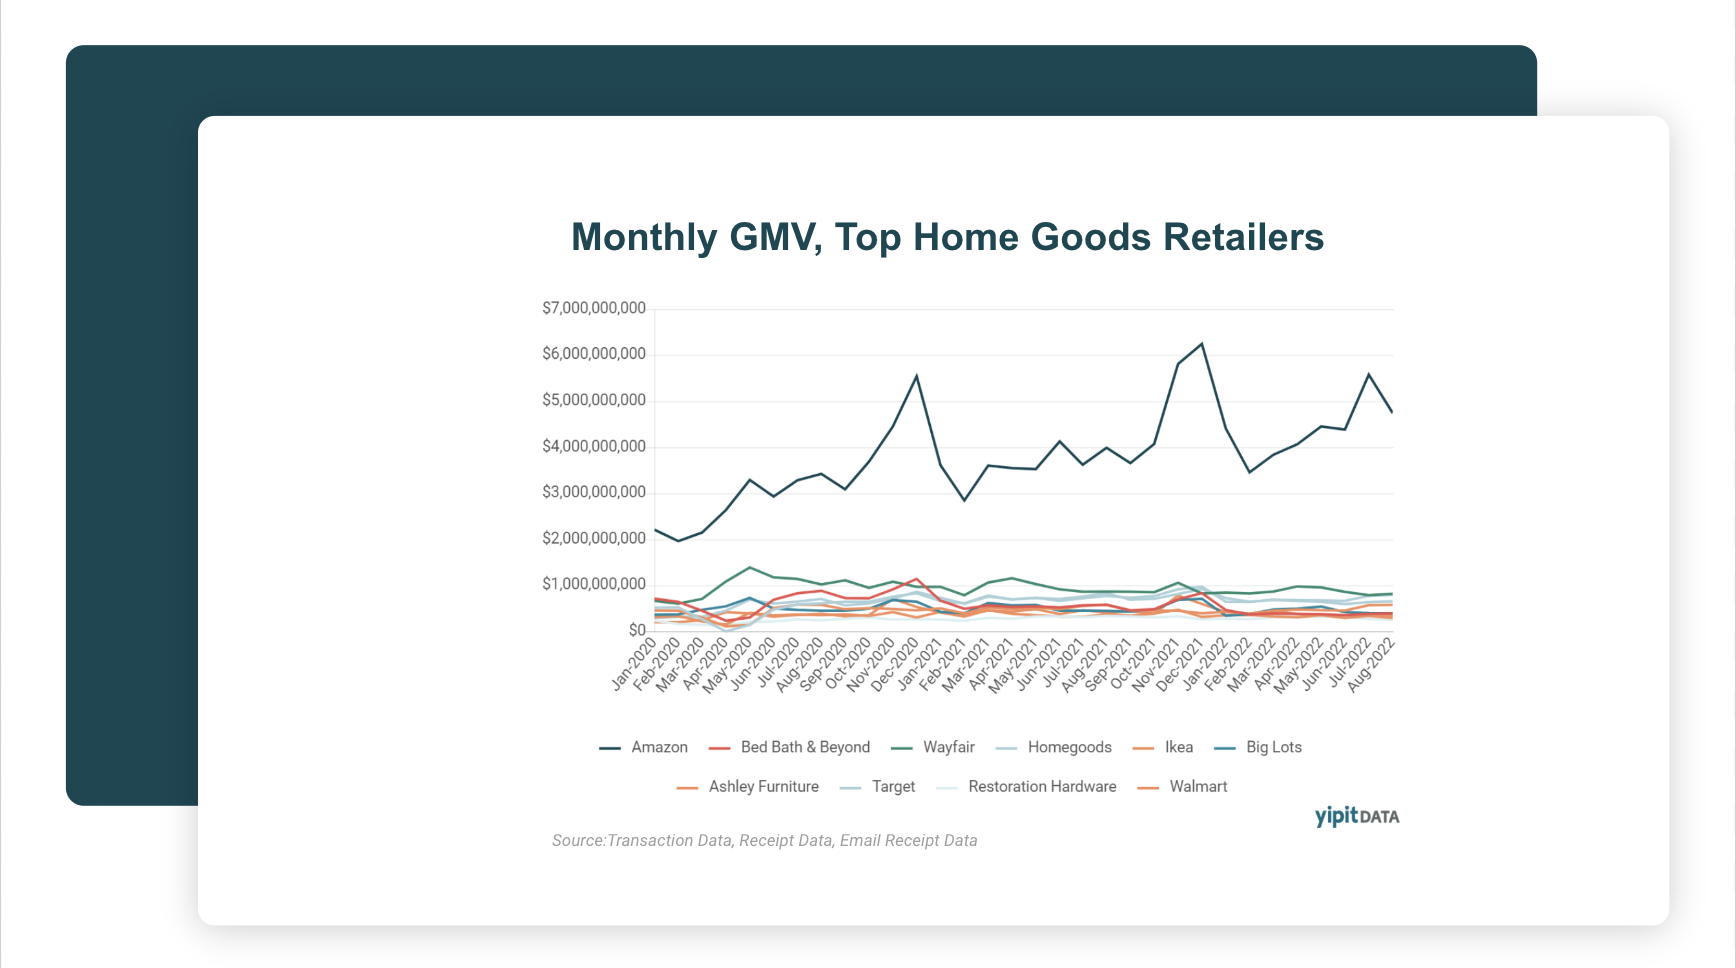
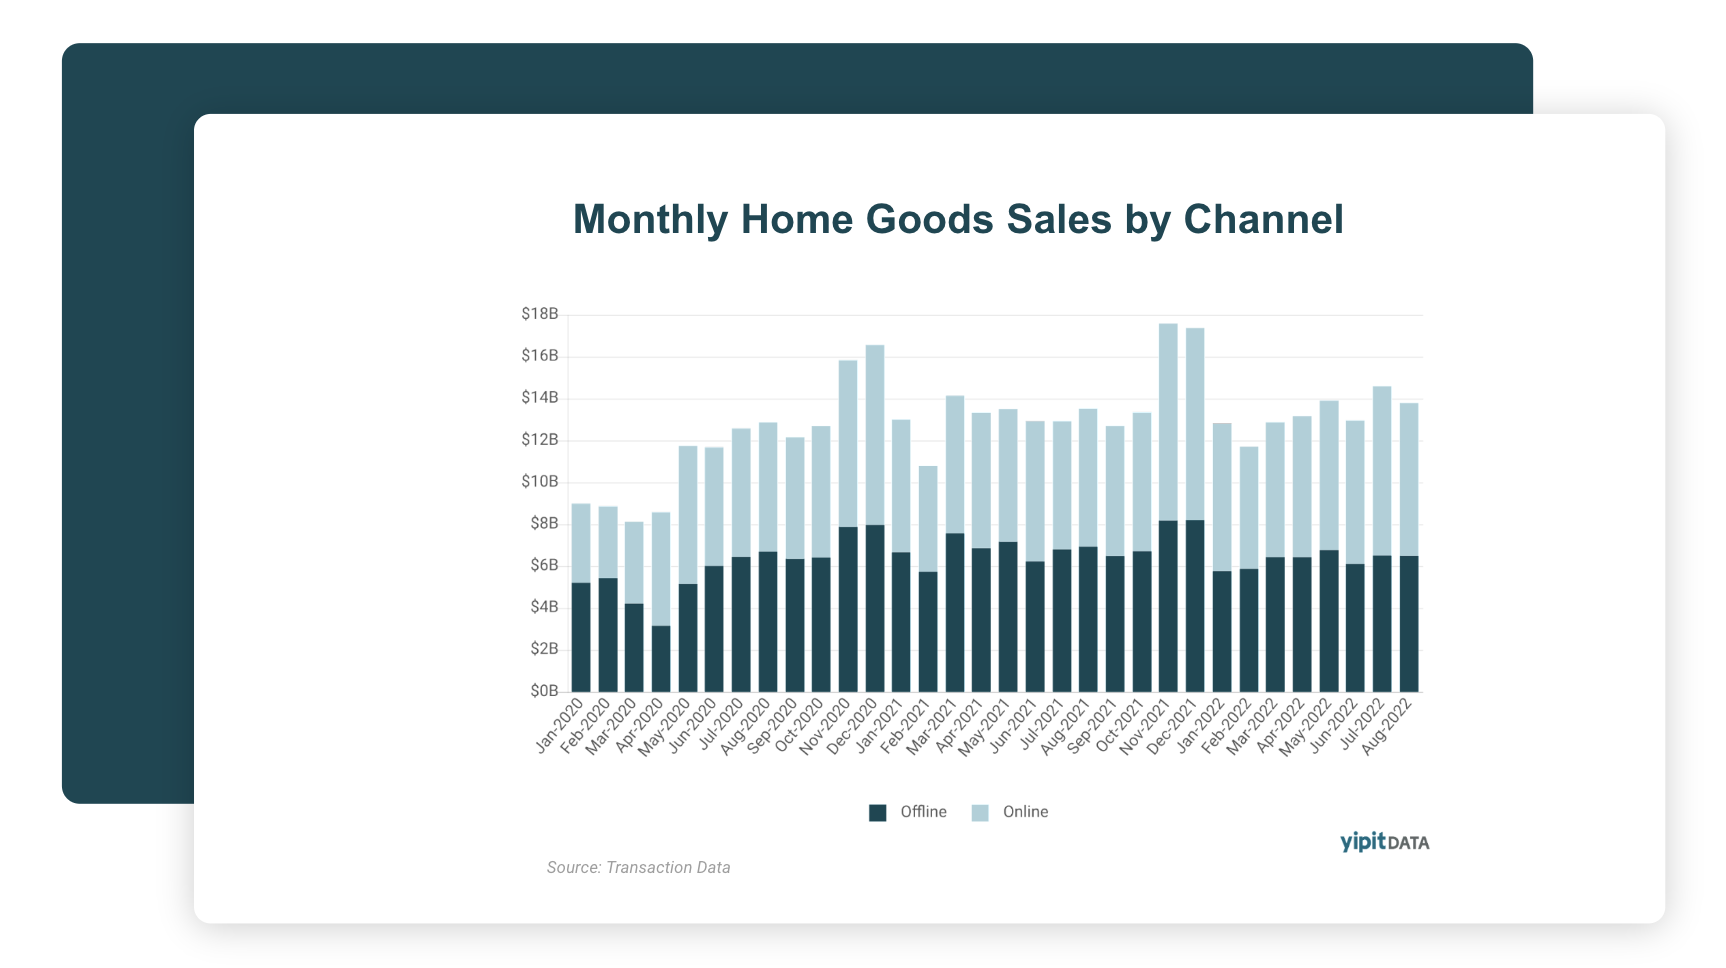
We report monthly gross merchandise value (GMV) for the top retailers and pure-players in the home goods industry, broken out by channel. This provides insight into market share changes and individual retailer performance.
.webp)
Our data shows monthly category sales on leading retailers, for both online and offline channels, allowing you to closely track category shifts at the retailers most important to your business.
Standard deliverable includes category breakdowns for your choice of three retailers, with the ability to add more.
See online and offline sales for top retailers and pure-players in the home goods industry, allowing you to gain insight into the trends for the industry as a whole.
YipitData’s new Market Tracker empowers your team to make strategic decisions with confidence through the power of data and insights.
Contextualize your performance vs the industry with standardized monthly sales reporting, and identify areas of opportunity with ease.
Optimize assortment planning strategies with sales visibility into retail competitors of your choice, at the category level.
Understand your brands true performance at top retailers including Target and Wayfair, with only a 7–10 day lag.
Keep a pulse on brand health with options to dig deeper on consumer purchase behavior across demographic splits including age + income.