4Q23 Home Goods Market Share Index: Pure Players


*Crate & Barrel includes CB2 sales; Bed Bath & Beyond pre-Overstock purchase is not included in this iteration of the Home Goods Market Share Index given that the retailer closed its doors on July 31, 2023. The Bed Bath & Beyond listed on this index includes GMV for Overstock.com pre-July 31, 2023, and for its rebranded website BedBathAndBeyond.com post-July 31.
Does not include Amazon, Walmart, Target as this index is focused on the pure play retailers
Source: Transaction data
Published 01/18/24
A real-time, granular view of your digital market share and why it’s changing.
Interested in learning more?
Key Takeaways
Quarterly Insights

The home goods industry continues to decline
The home market continues to shrink with sales declining 4% in 4Q23 YoY, continuing a 8-quarter streak of negative sales growth.
4Q23 Spotlight
TJX Companies: HomeSense, HomeGoods

HomeSense and HomeGoods see strong YoY sales growth
HomeSense and HomeGoods, both TJX companies, had some of the strongest YoY sales growth in 4Q23 among home retail pure players. Both companies well over-indexed compared to the Home Goods industry.
HomeSense, a Canadian chain, is a relatively new player in the U.S. market with its first U.S. store opening in 2017.
Williams Sonoma also saw a strong performance in 4Q23. 4Q is typically the highest grossing quarter of the year for Williams Sonoma, due to its popularity with holiday shoppers.

HomeSense adds 8 stores in 2023
HomeSense sales saw explosive growth in early 2023. One factor driving HomeSense’s performance is an increase in store openings. In January 2022, HomeSense had 39 stores. By January 2023 they had added 7 more. As of January 2024, they have over 54 stores.

HomeSense is growing a strong customer base
Growth of its customer base is another factor contributing to HomeSense’s strong GMV growth. The retailer saw explosive growth in its distinct monthly customers in early 2023, achieving over 100% YoY growth in Jan 2023. Further, HomeSense’s monthly distinct customers grew between 12% to 27% YoY during 4Q23.
Conversely, Williams Sonoma has seen YoY declines in its number of distinct monthly customers throughout 2023. The number of distinct monthly customers shopping at Williams Sonoma declined between -13% and -6% YoY.
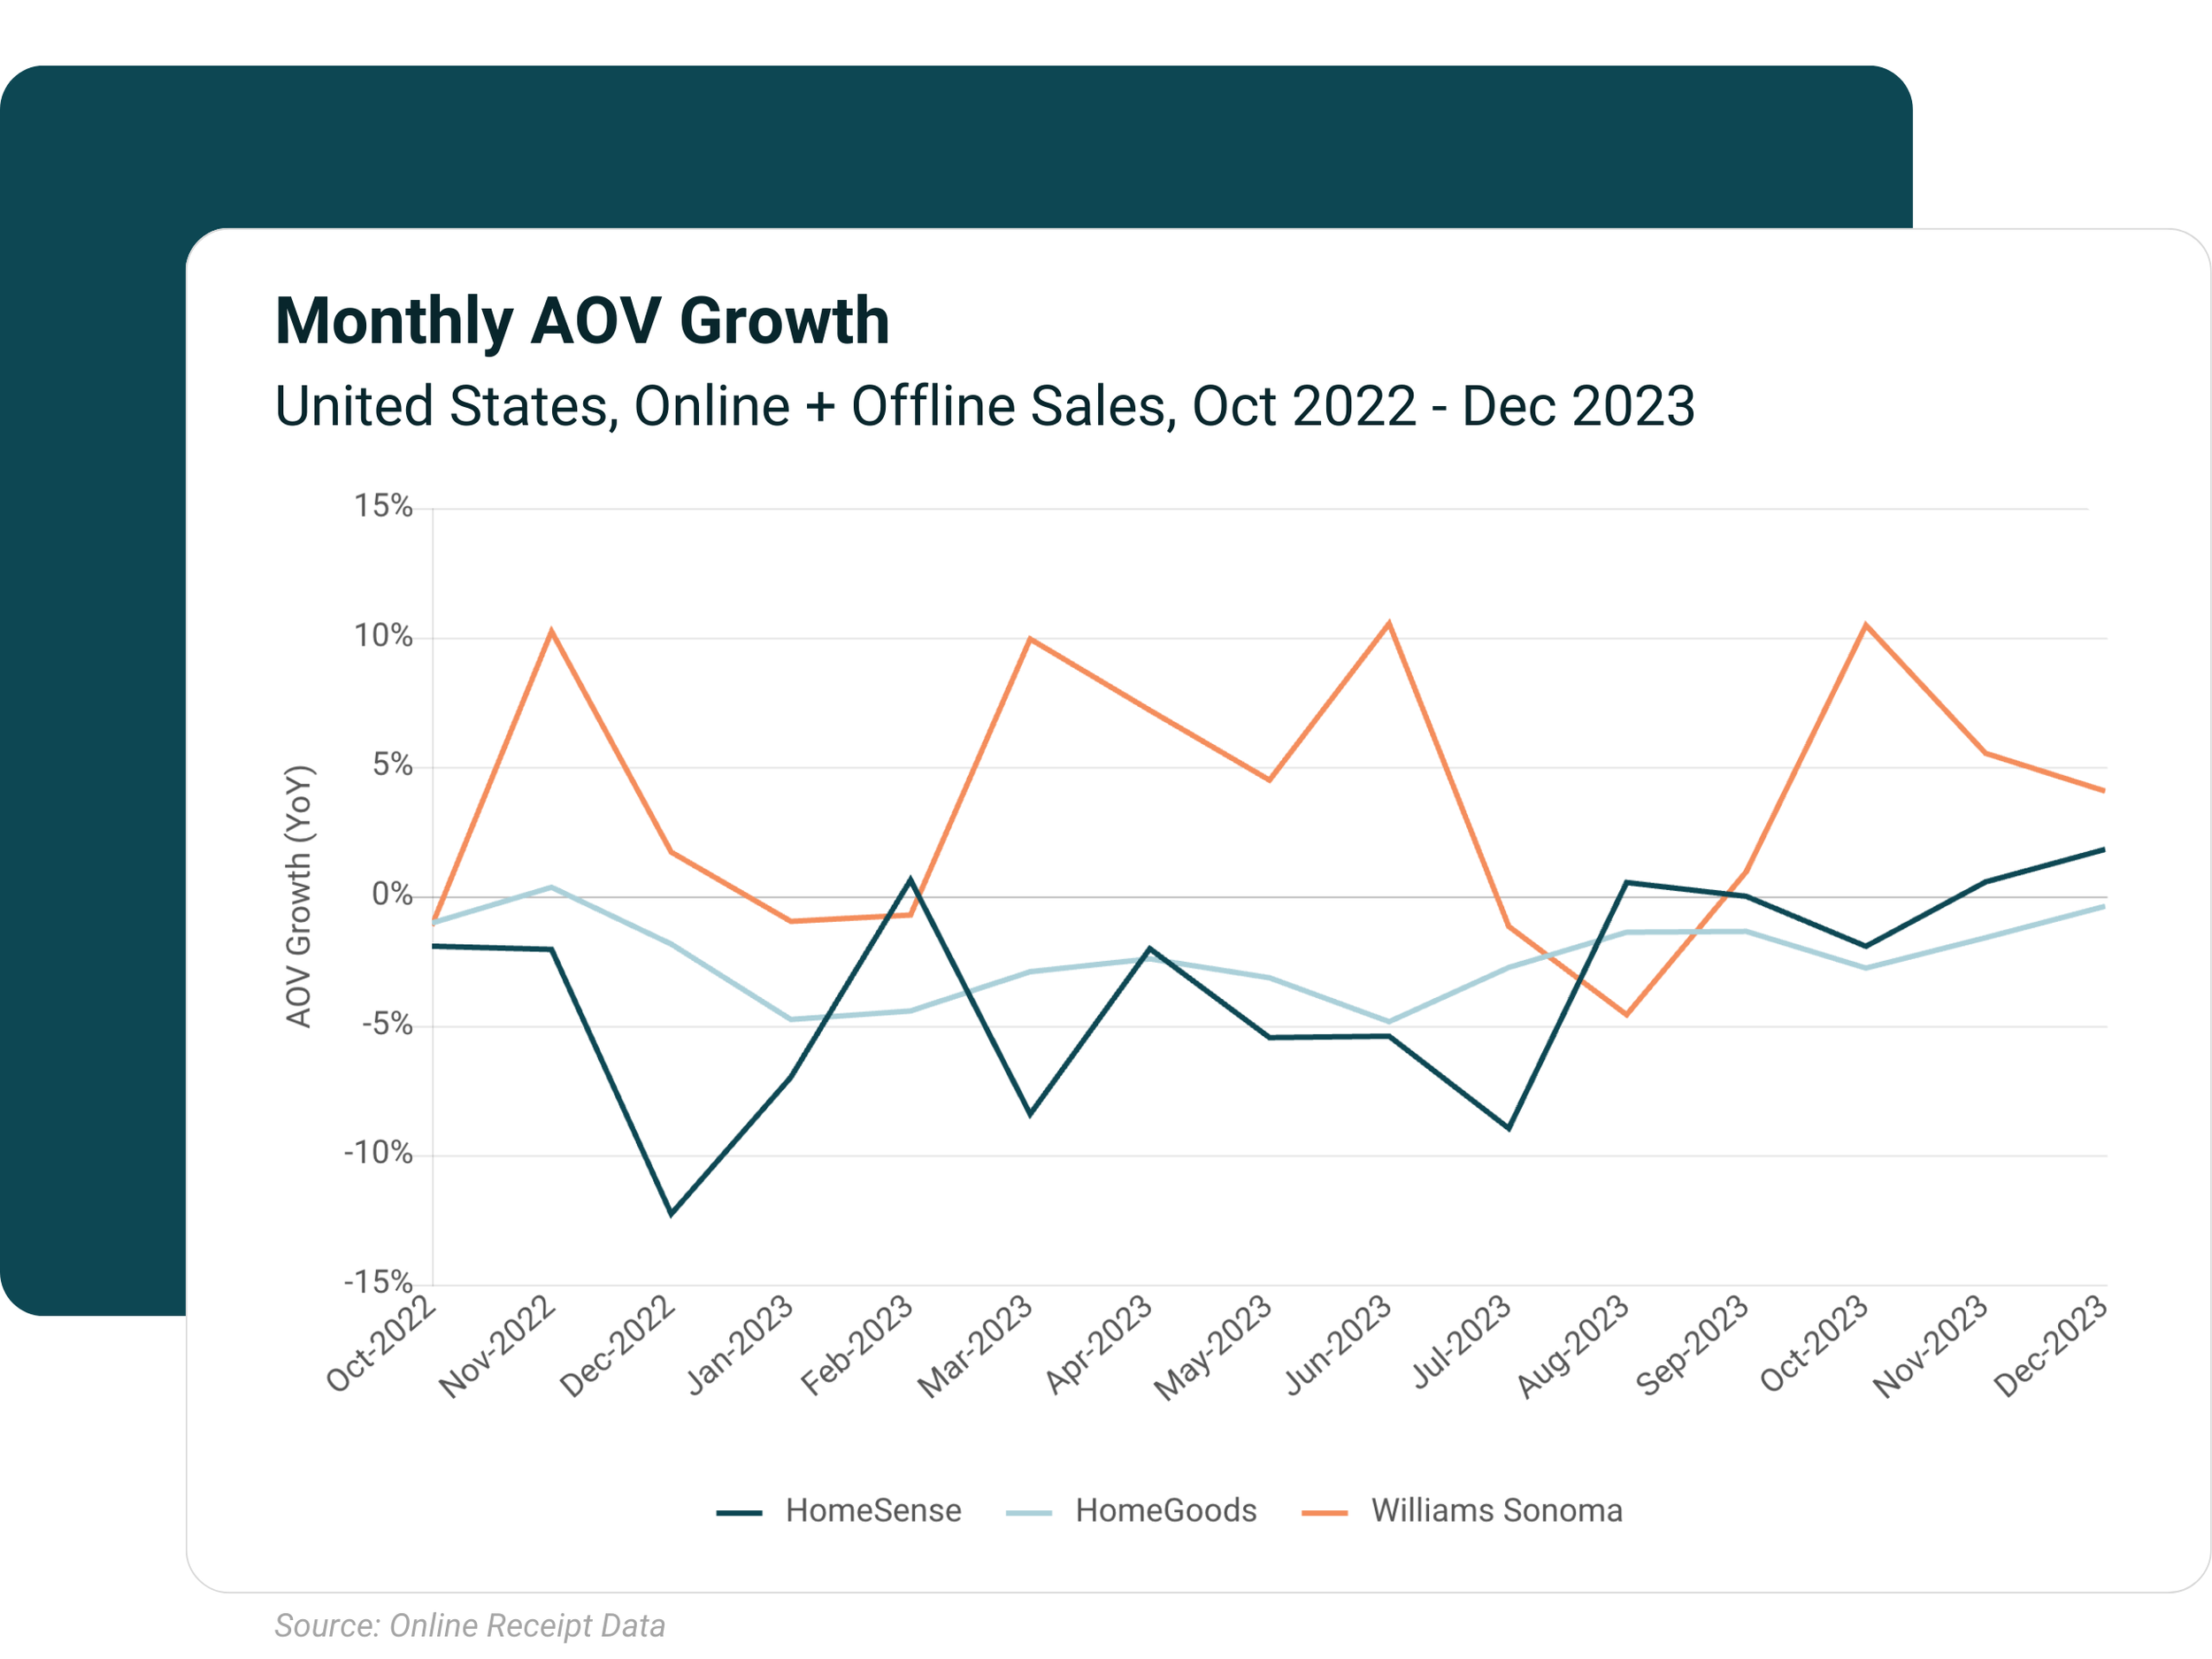
High AOV’s drive sales growth for Williams Sonoma
Higher AOVs, not higher number of customers, have been driving sales growth for Williams Sonoma. AOV at Williams Sonoma increased 5%-10% YoY in 4Q23.
The inverse was true for HomeGoods and HomeSense. HomeGoods and HomeSense saw declining AOVs for most of 2023.
About YipitData
YipitData is a trusted data partner for over 480 of the world’s largest investment funds and companies. We give retailers & brands accurate and granular market share insights across channels and categories, helping them identify opportunities to outperform.
Index References