3Q23 Home Goods Market Share Index: Pure Players


*Crate & Barrel includes CB2 sales; Bed Bath & Beyond pre-Overstock purchase is not included in this iteration of the Home Goods Market Share Index given that the retailer closed its doors on July 30, 2023. The Bed Bath & Beyond listed on this index includes GMV for Overstock.com pre-July 30, 2023, and for its rebranded website BedBathAndBeyond.com post-July 30.
Does not include Amazon, Walmart, Target as this index is focused on the pure play retailers
Source: Transaction data
Published 10/17/23
A real-time, granular view of your digital market share and why it’s changing.
Interested in learning more?
Key Takeaways
Quarterly Insights

The home goods industry continues to decline
The home market continues to shrink with sales declining 6% in 3Q23 YoY, continuing a 7-quarter streak of negative sales growth.

Some generalist retailers experience similar home retail sales declines
Target home retail sales have suffered negative sales growth for the past year, with online sales declining -by 17% and brick-and-mortar sales declining -by 9% YoY. Walmart’s home retail sales have been hit hard with brick-and-mortar sales growth remaining in the negatives for the past 7 quarters. Online home sales for Walmart have been doing well, with home growing 13% YoY in 3Q 2023.
Amazon, on the other hand, continues to see climbing home retail sales, with home retail growing an astounding 25% YoY.
3Q23 Spotlight
Bed Bath & Beyond 2.0

Overstock rebrands to BedBathAndBeyond.com
The last month Overstock.com had positive sales growth was in November 2021. Since then the online retailer has suffered nearly two years of declining sales growth. With the purchase and rebrand to BedBathAndBeyond.com in August 2023, the retailer saw softening declines in sales growth, which went from -25% YoY to -11 % YoY but the strategic move has yet to impact sales performance in a positive way.
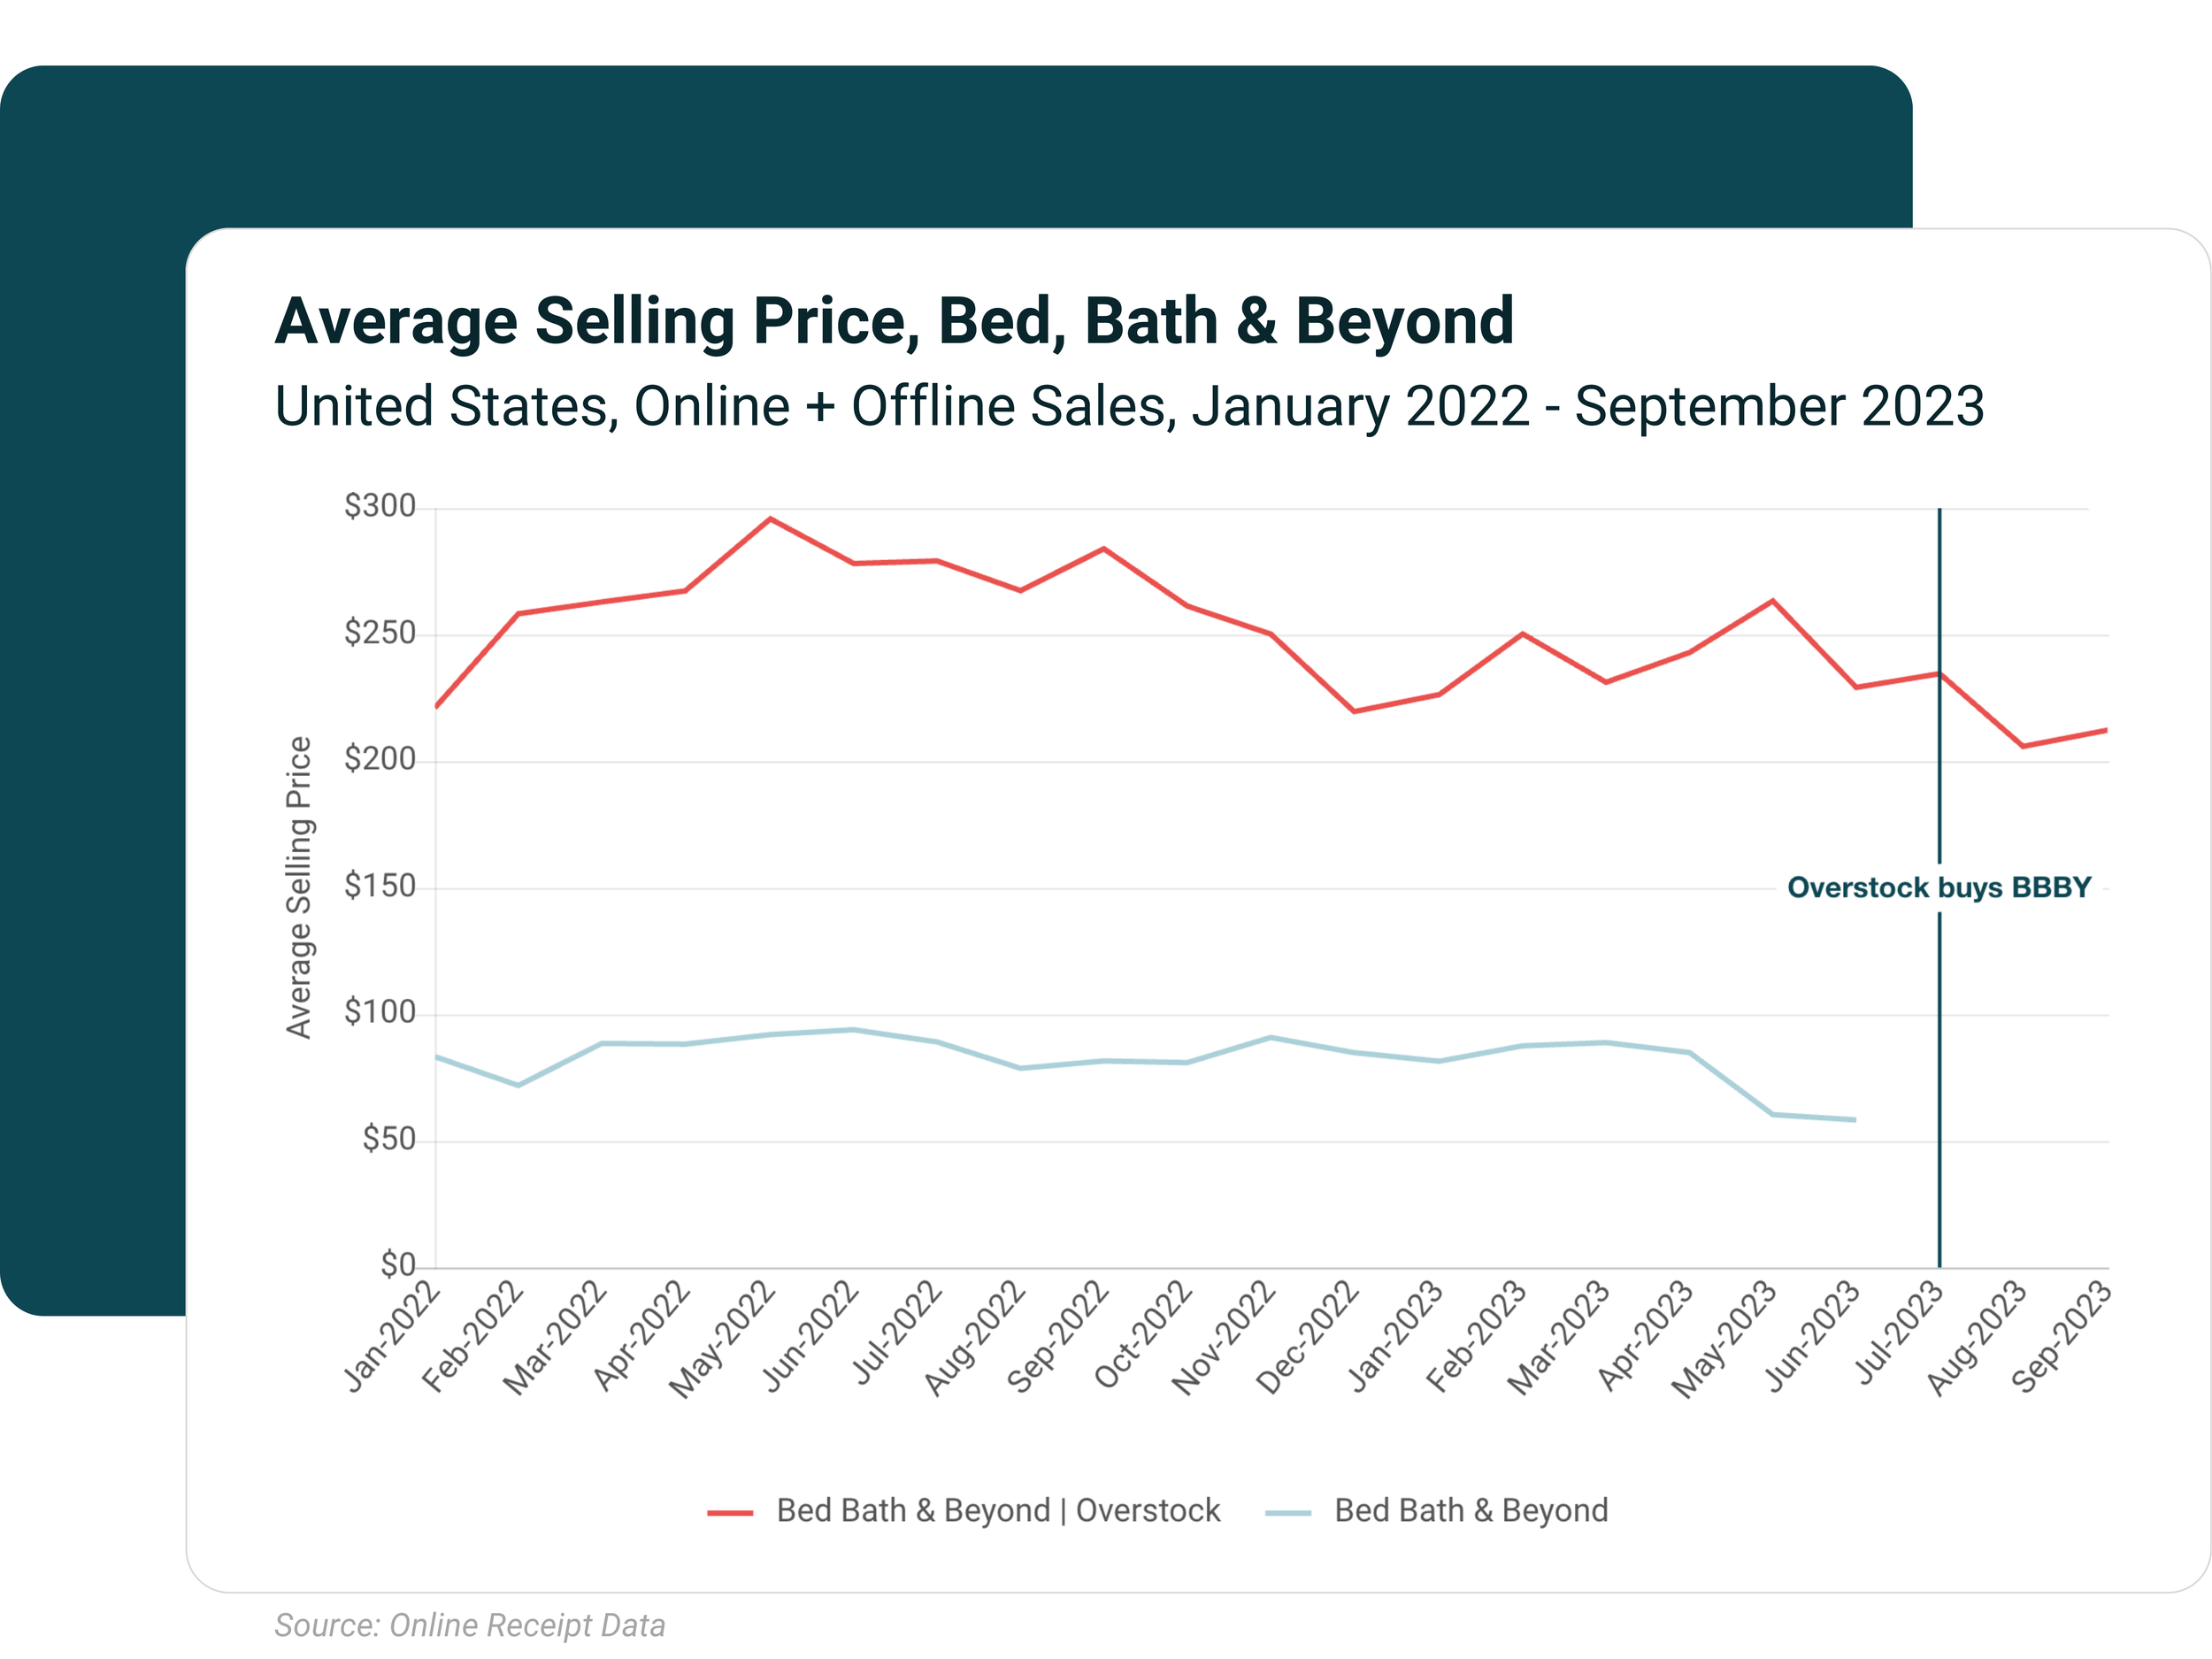
Overstock ASP Evolution
Prior to its rebrand to BedBathAndBeyond.com, Overstock’s ASP was north of $200, a significantly higher value than Bed Bath & Beyond’s online ASP of $80-$90. With the rebrand to BedBathAndBeyond.com, it will be interesting to see if BBBY/Overstock will maintain a higher ASP or go for products with lower ticket prices.

BBBY shoppers growing spending at HomeGoods
Bed Bath & Beyond online shoppers have increasingly devoted a larger share of their wallet to HomeGoods. In a span of a year, HomeGoods’s wallet share among Bed Bath & Beyond online shoppers (pre-Overstock purchase) grew from 10% to 14% in 3Q 2023.
With Overstock rebranding to BedBathAndBeyond.com, it might have a tough job drawing back customers from other retailers, such as HomeGoods and IKEA, which have grown popular with its inherited customer base.
*Wallet share was calculated by looking at sales generated from BBBY online customers (pre-Overstock rebrand) at the retailers listed in the index.
About YipitData
YipitData is a trusted data partner for over 480 of the world’s largest investment funds and companies. We give retailers & brands accurate and granular market share insights across channels and categories, helping them identify opportunities to outperform.
Index References