


*Crate & Barrel includes CB2 sales; Bed Bath & Beyond does not include subsidiaries Harmon Face Values + Buy Buy Baby
Does not include Amazon, Walmart, Target as this index is focused on the pure play retailers
Source: Transaction data
Published 4/20/23
A real-time, granular view of your digital market share and why it’s changing.
Interested in learning more?
Key Takeaways
Quarterly Insights
Industry Performance
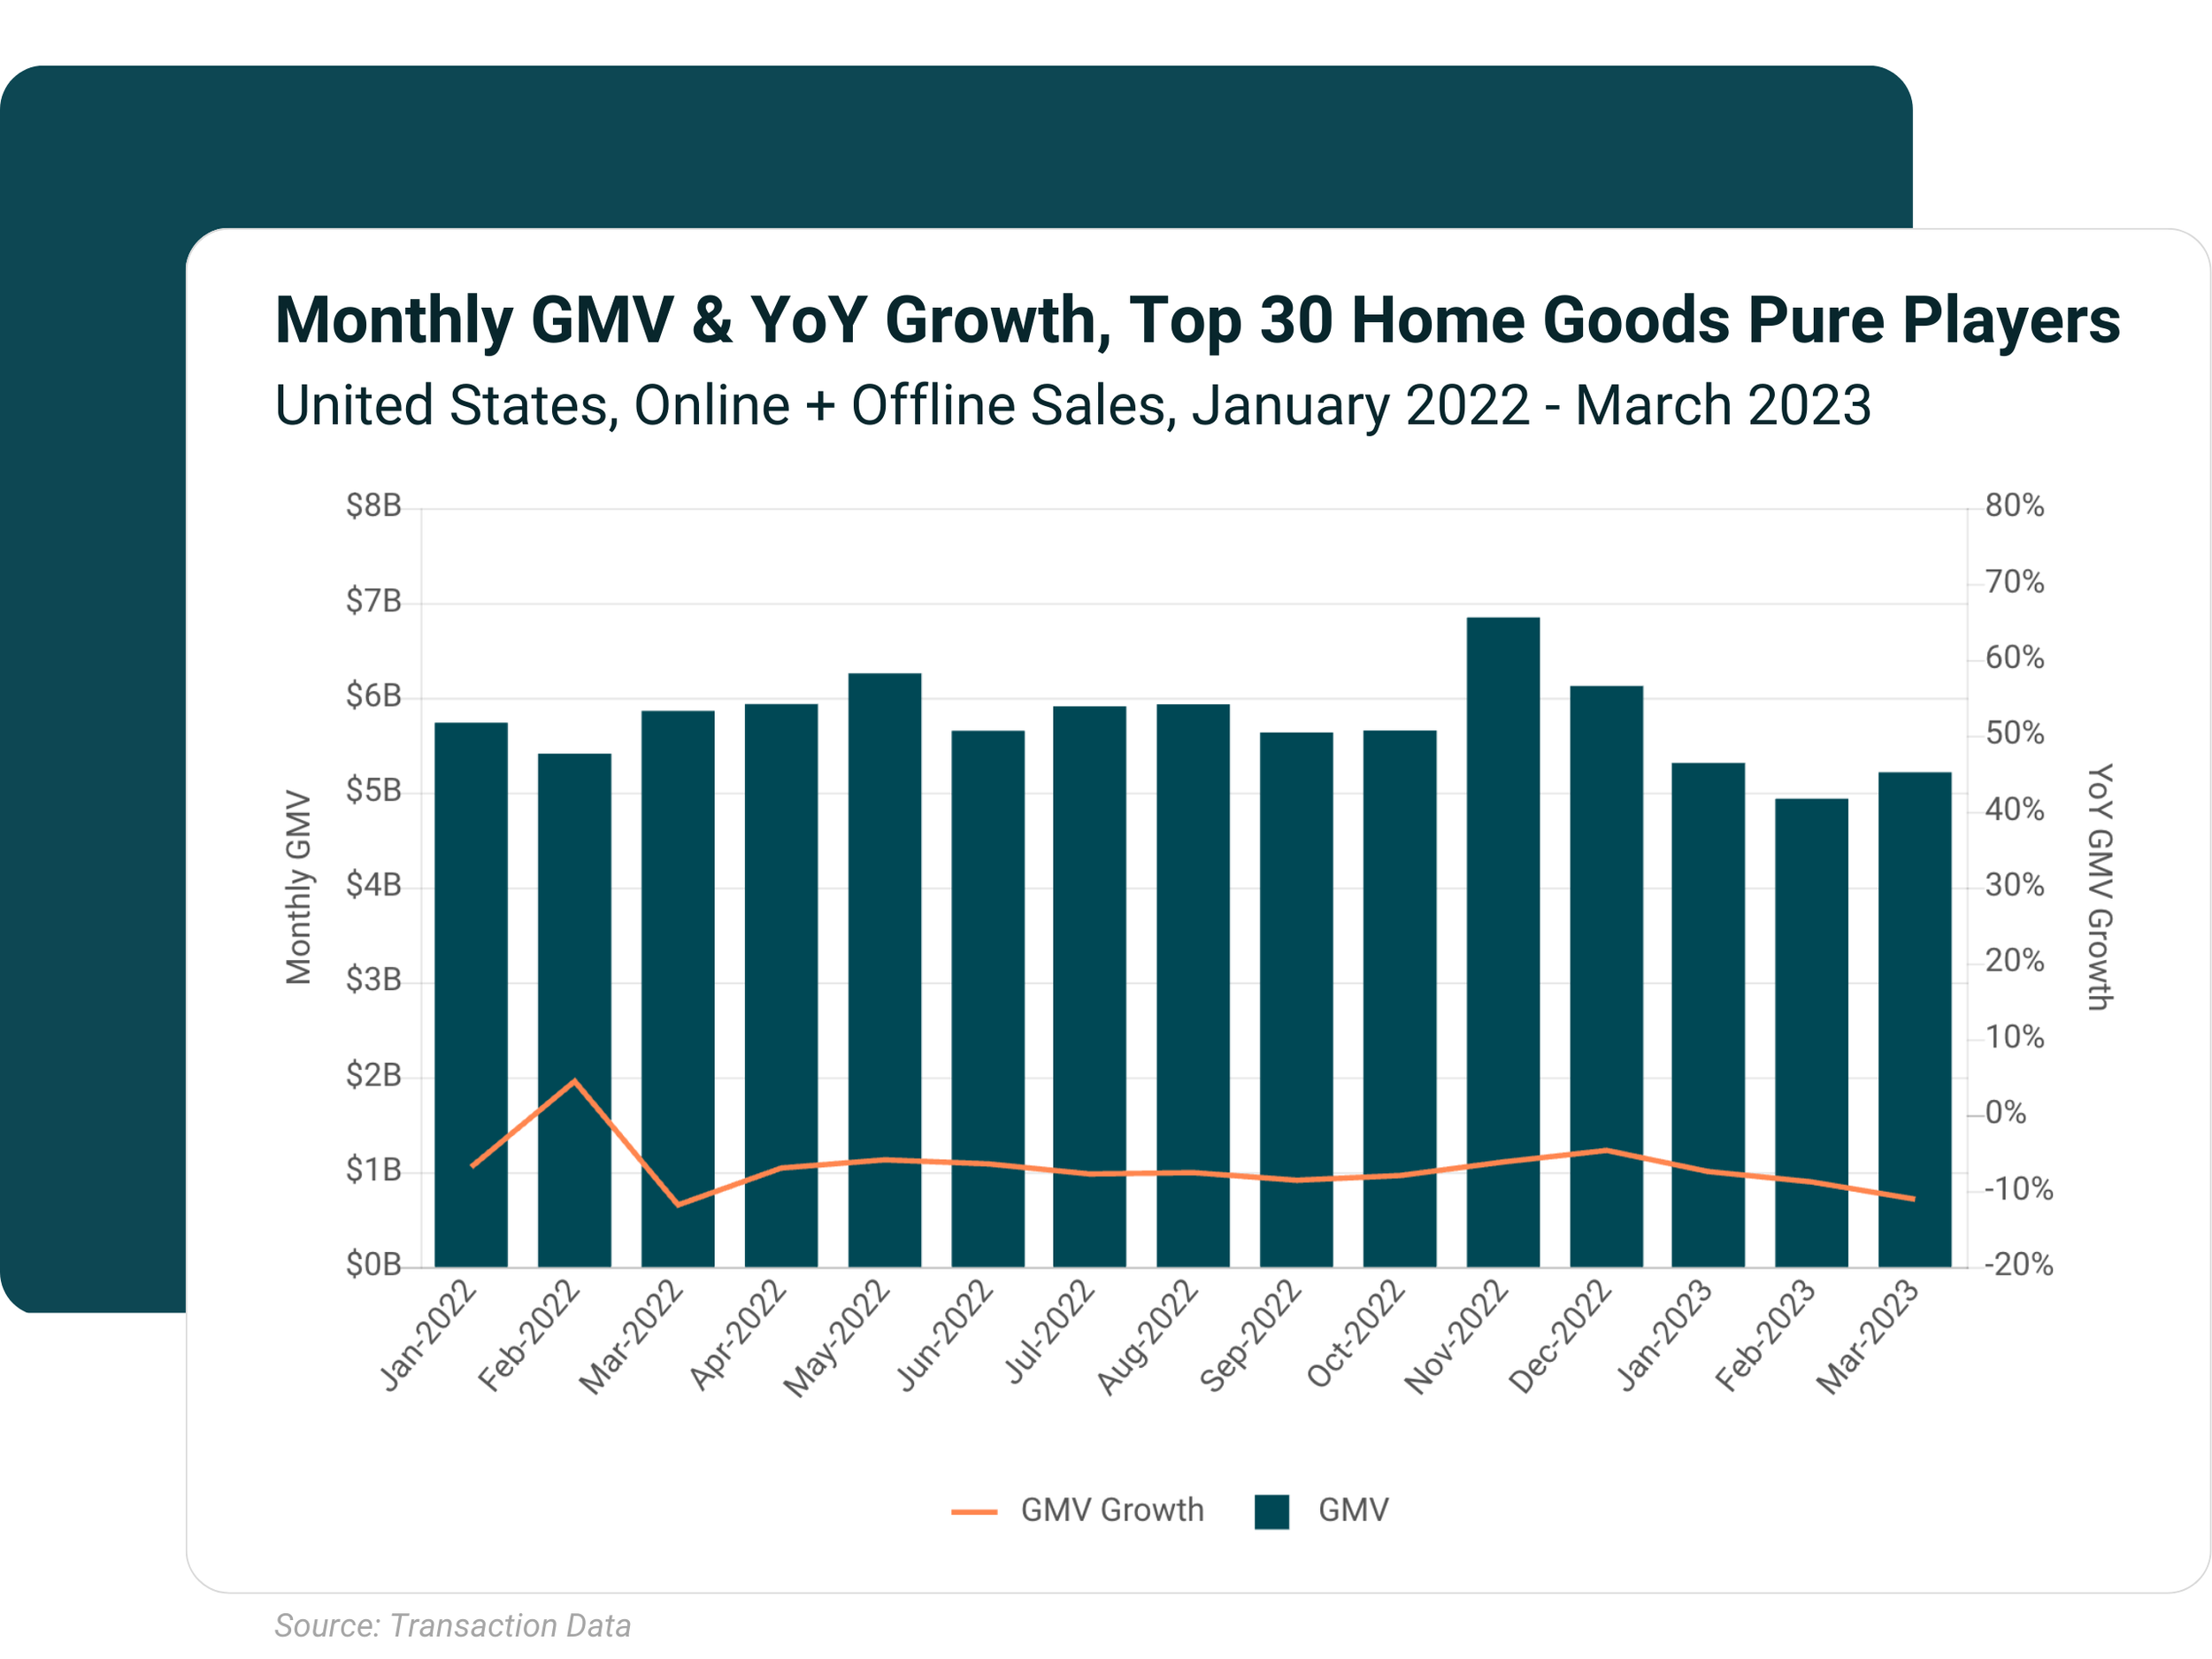
How is the industry fairing overall? The home market continues to shrink: total home goods GMV declined 9% in 1Q23 YoY.
Has demand for home furniture and goods maintained or is it tapering? 2022 was a tough year for the home goods industry with every quarter posting negative YoY sales growth ranging between -8% to -5%. 2023 continued that trend, with GMV growth declining even further.
1Q23 Spotlight
IKEA
Positive GMV growth
IKEA’s sales growth climbed to improve 21pp over the course of 2022 from -11% sales in 1Q 2022 to 10% in 4Q 2022.
IKEA continued to have positive sales growth in 1Q 2023, with sales increase of 9% YoY.

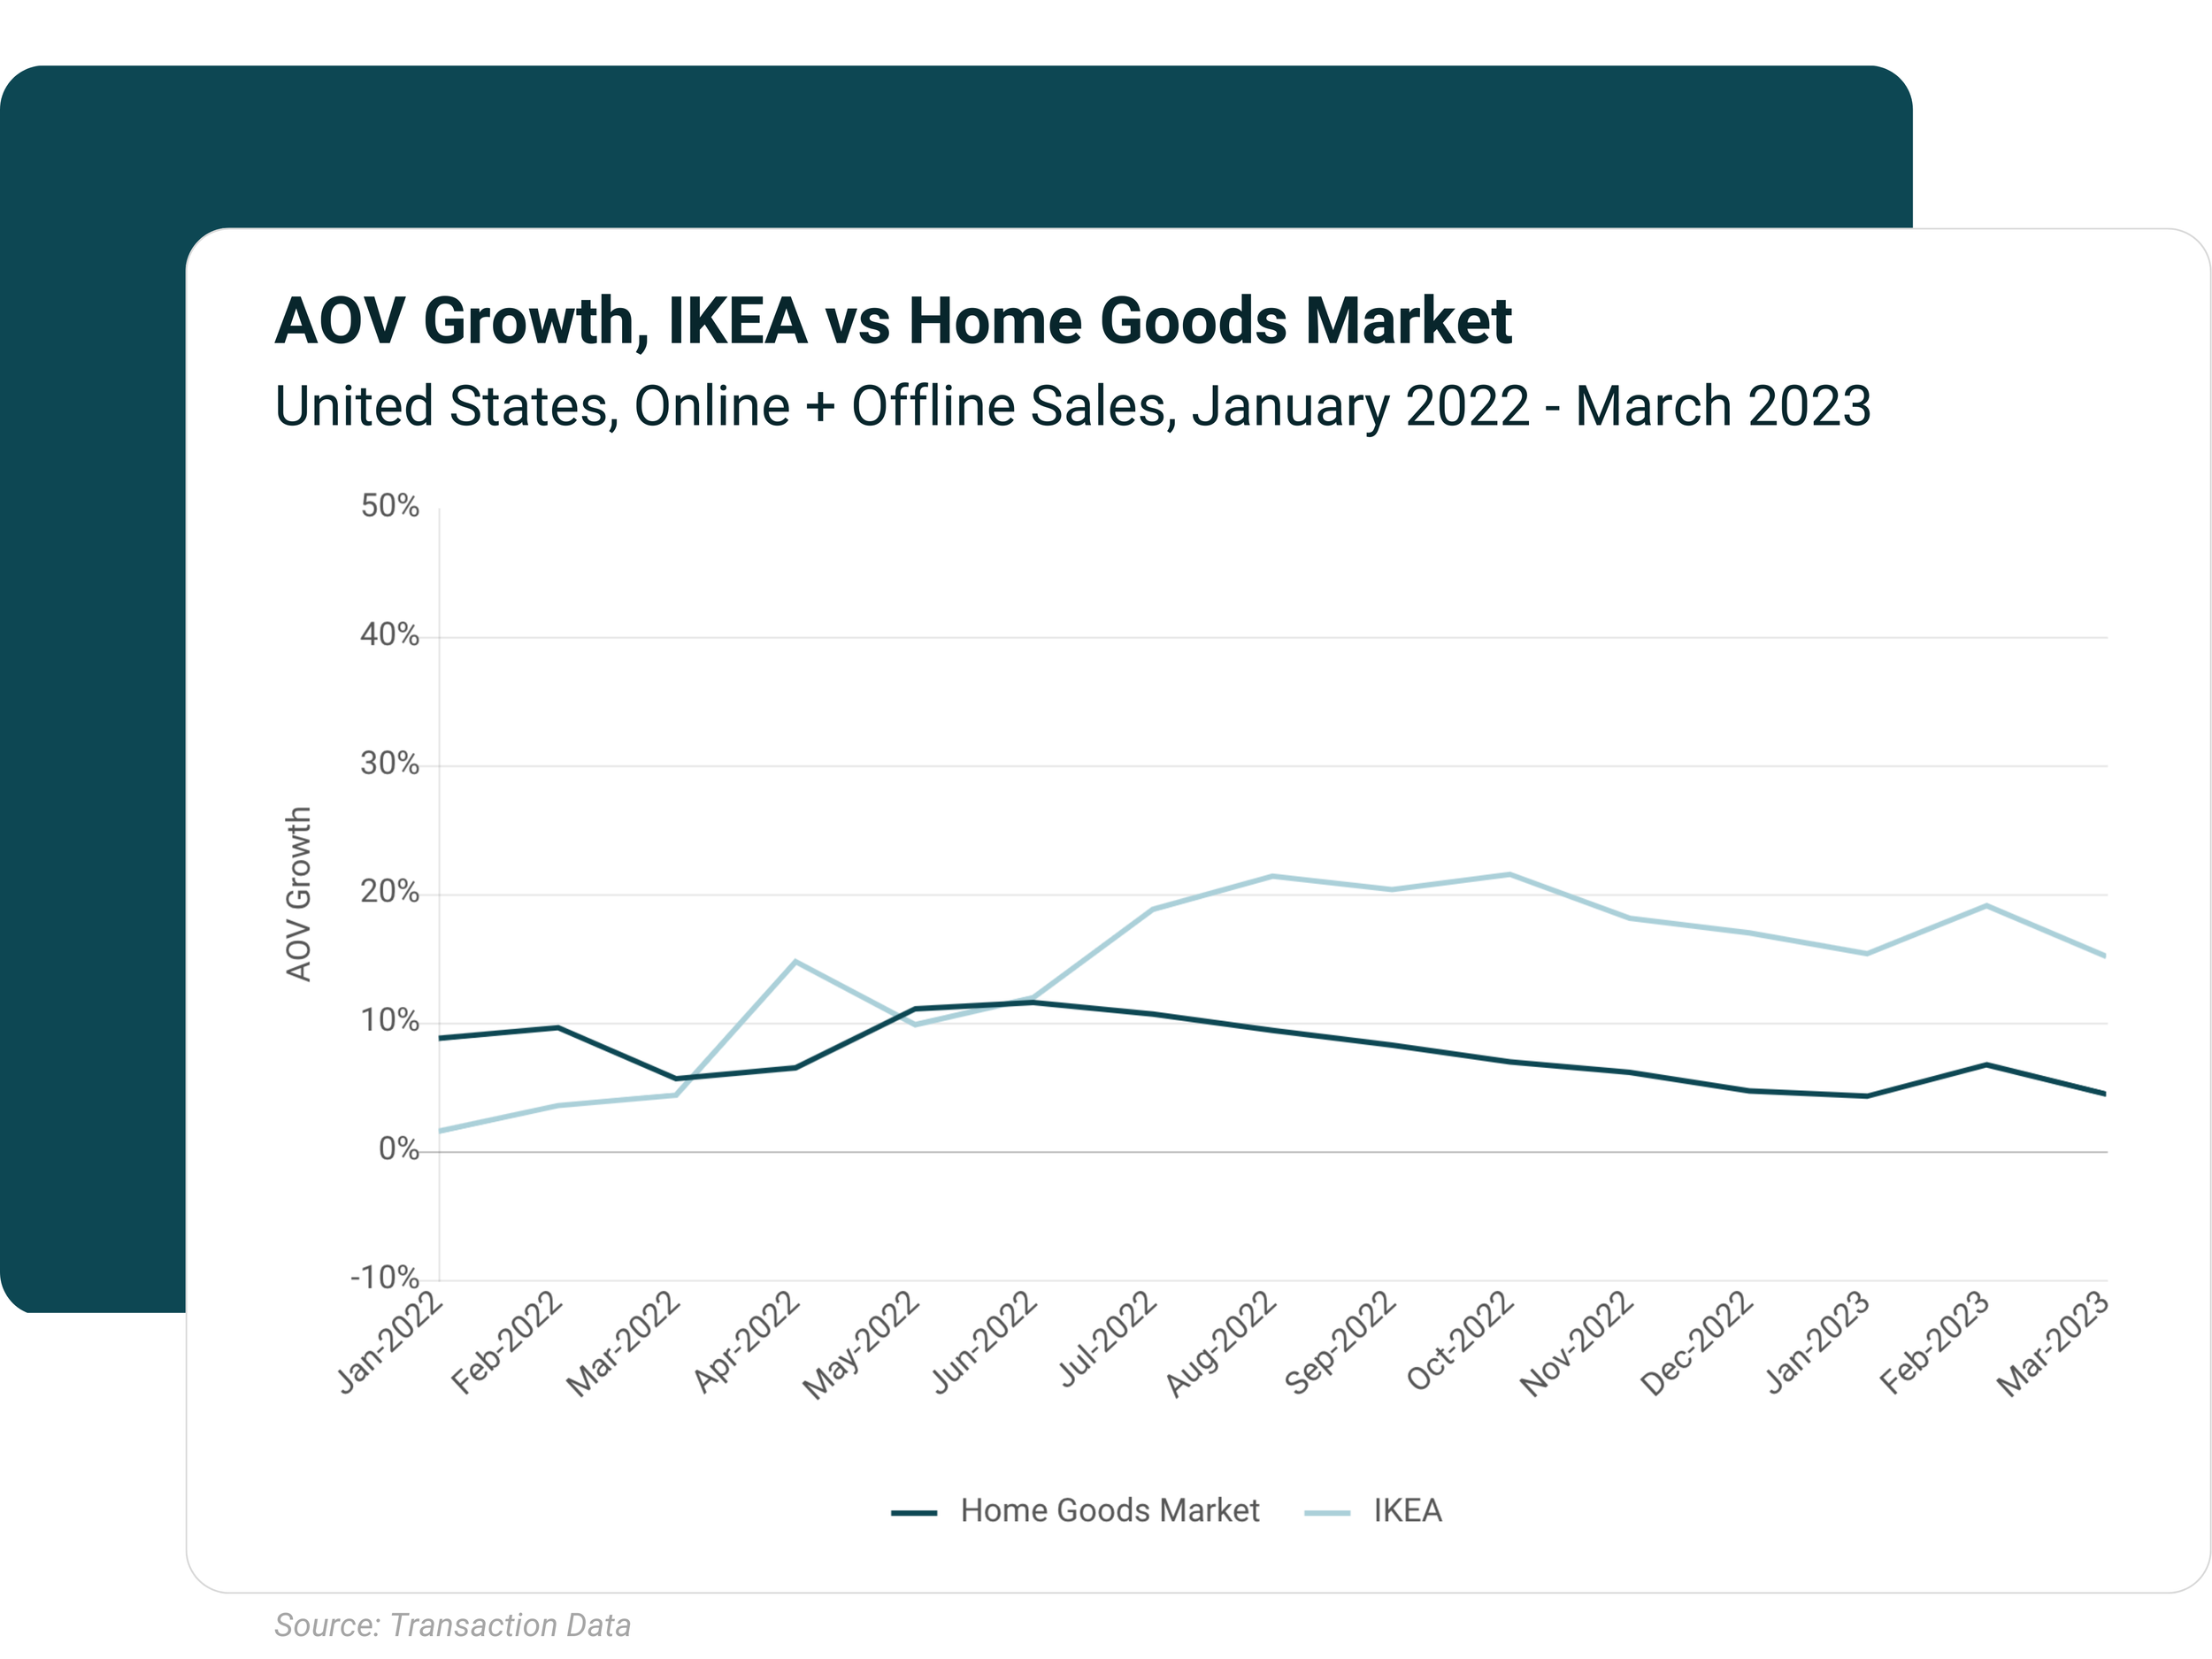
AOV growth outpacing home goods industry
For the past 13 months, AOV among IKEA shoppers has grown faster than AOV for the home goods industry overall.
In 2022, IKEA’s AOV increased as much as 22% YoY whereas AOV grew only 3% YoY in the same month. IKEA’s AOV growth continues to exceed the home goods industry in 1Q 2023.
About YipitData
YipitData is a trusted data partner for over 480 of the world’s largest investment funds and companies. We give retailers & brands accurate and granular market share insights across channels and categories, helping them identify opportunities to outperform.
Index References