
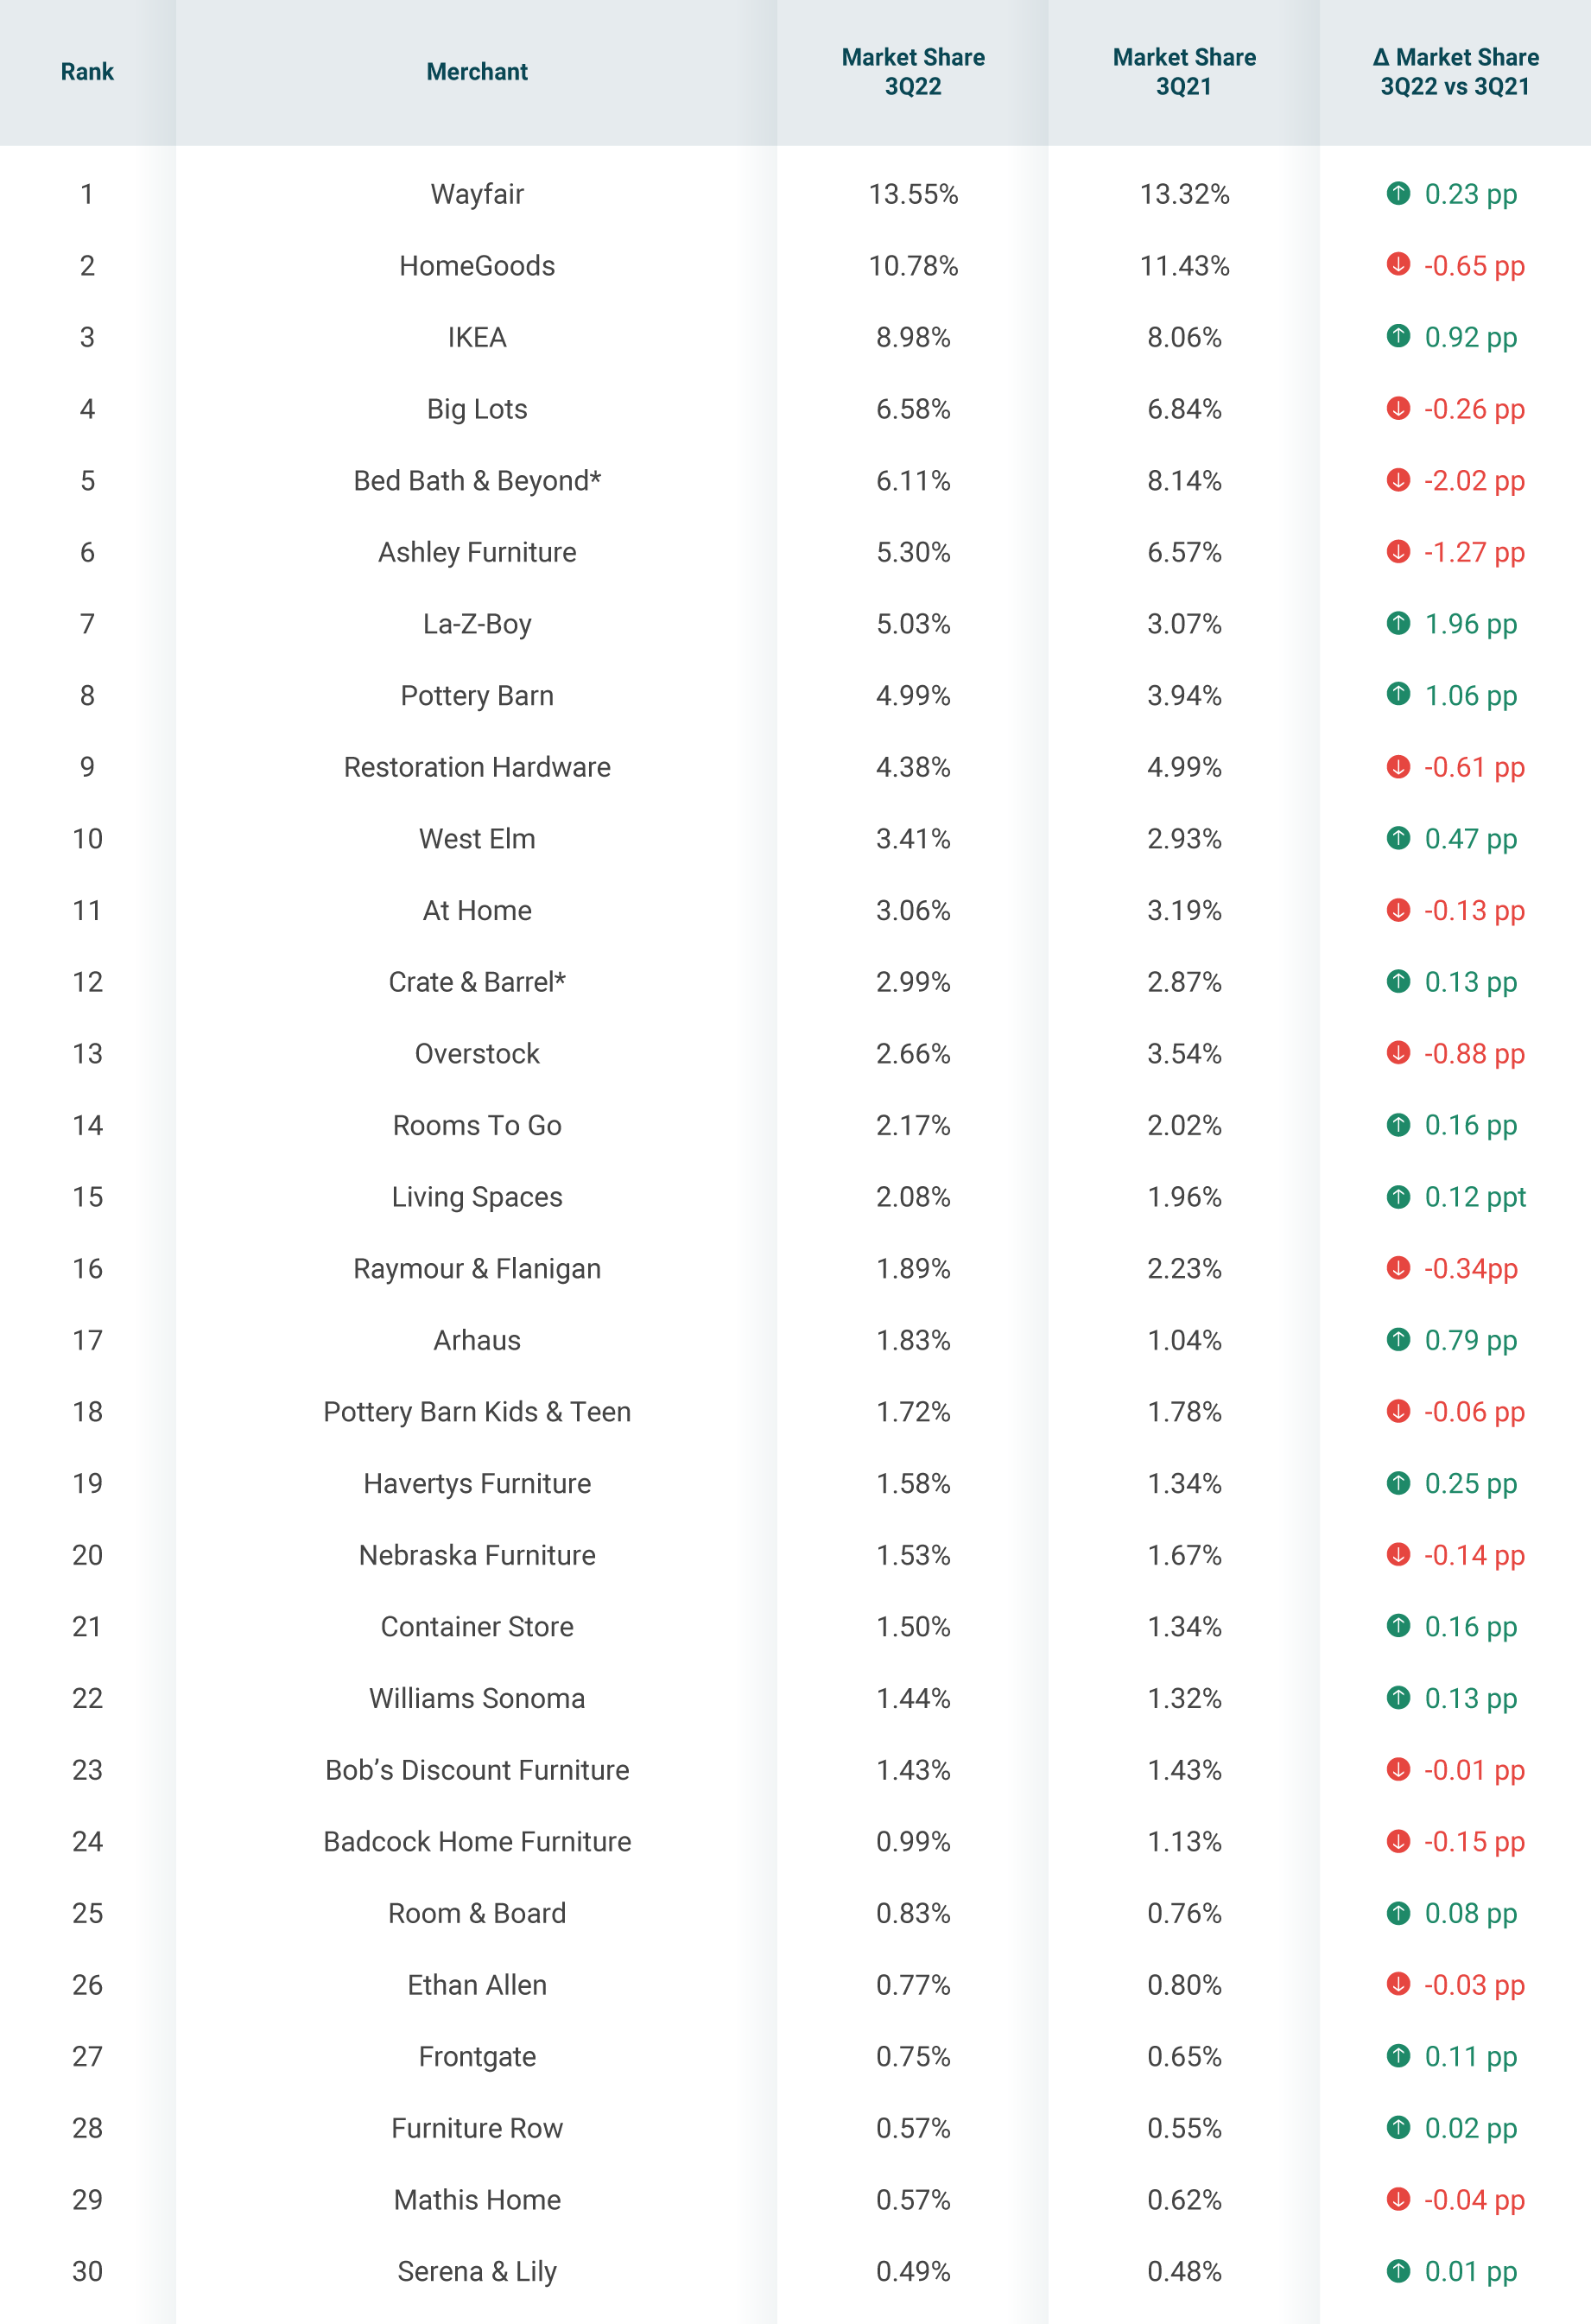
*Crate & Barrel includes CB2 sales; Bed Bath and Beyond does not include subsidiaries Harmon Face Values + Buy Buy Baby
Does not include Amazon, Walmart, Target as this index is focused on the pure play retailers
Source: Transaction data
Published 10/24/22
A real-time, granular view of your digital market share and why it’s changing.
Interested in learning more?
Key Takeaways
Quarterly Insights
Industry Performance
How is the industry fairing overall? Besides a peak in YoY Growth in February 2022 home goods sales have been mired by negative GMV growth, ranging between -15% and -5% YoY.
Has demand for home furniture and goods maintained or is it tapering? GMV Share for online sales (versus brick-and-mortar) is fairly consistent YoY. Between July and September 2022, GMV share for online sales has remained between 31%-36%.

Consumer Behavior
How has consumer spending shifted? Despite consumers shopping less frequently for home goods in 2022 compared to last year, average consumer spend per quarter has maintained for the past two years, with average quarterly spend in 3Q22 being $3 higher than last year.

Winner Spotlight
Arhaus
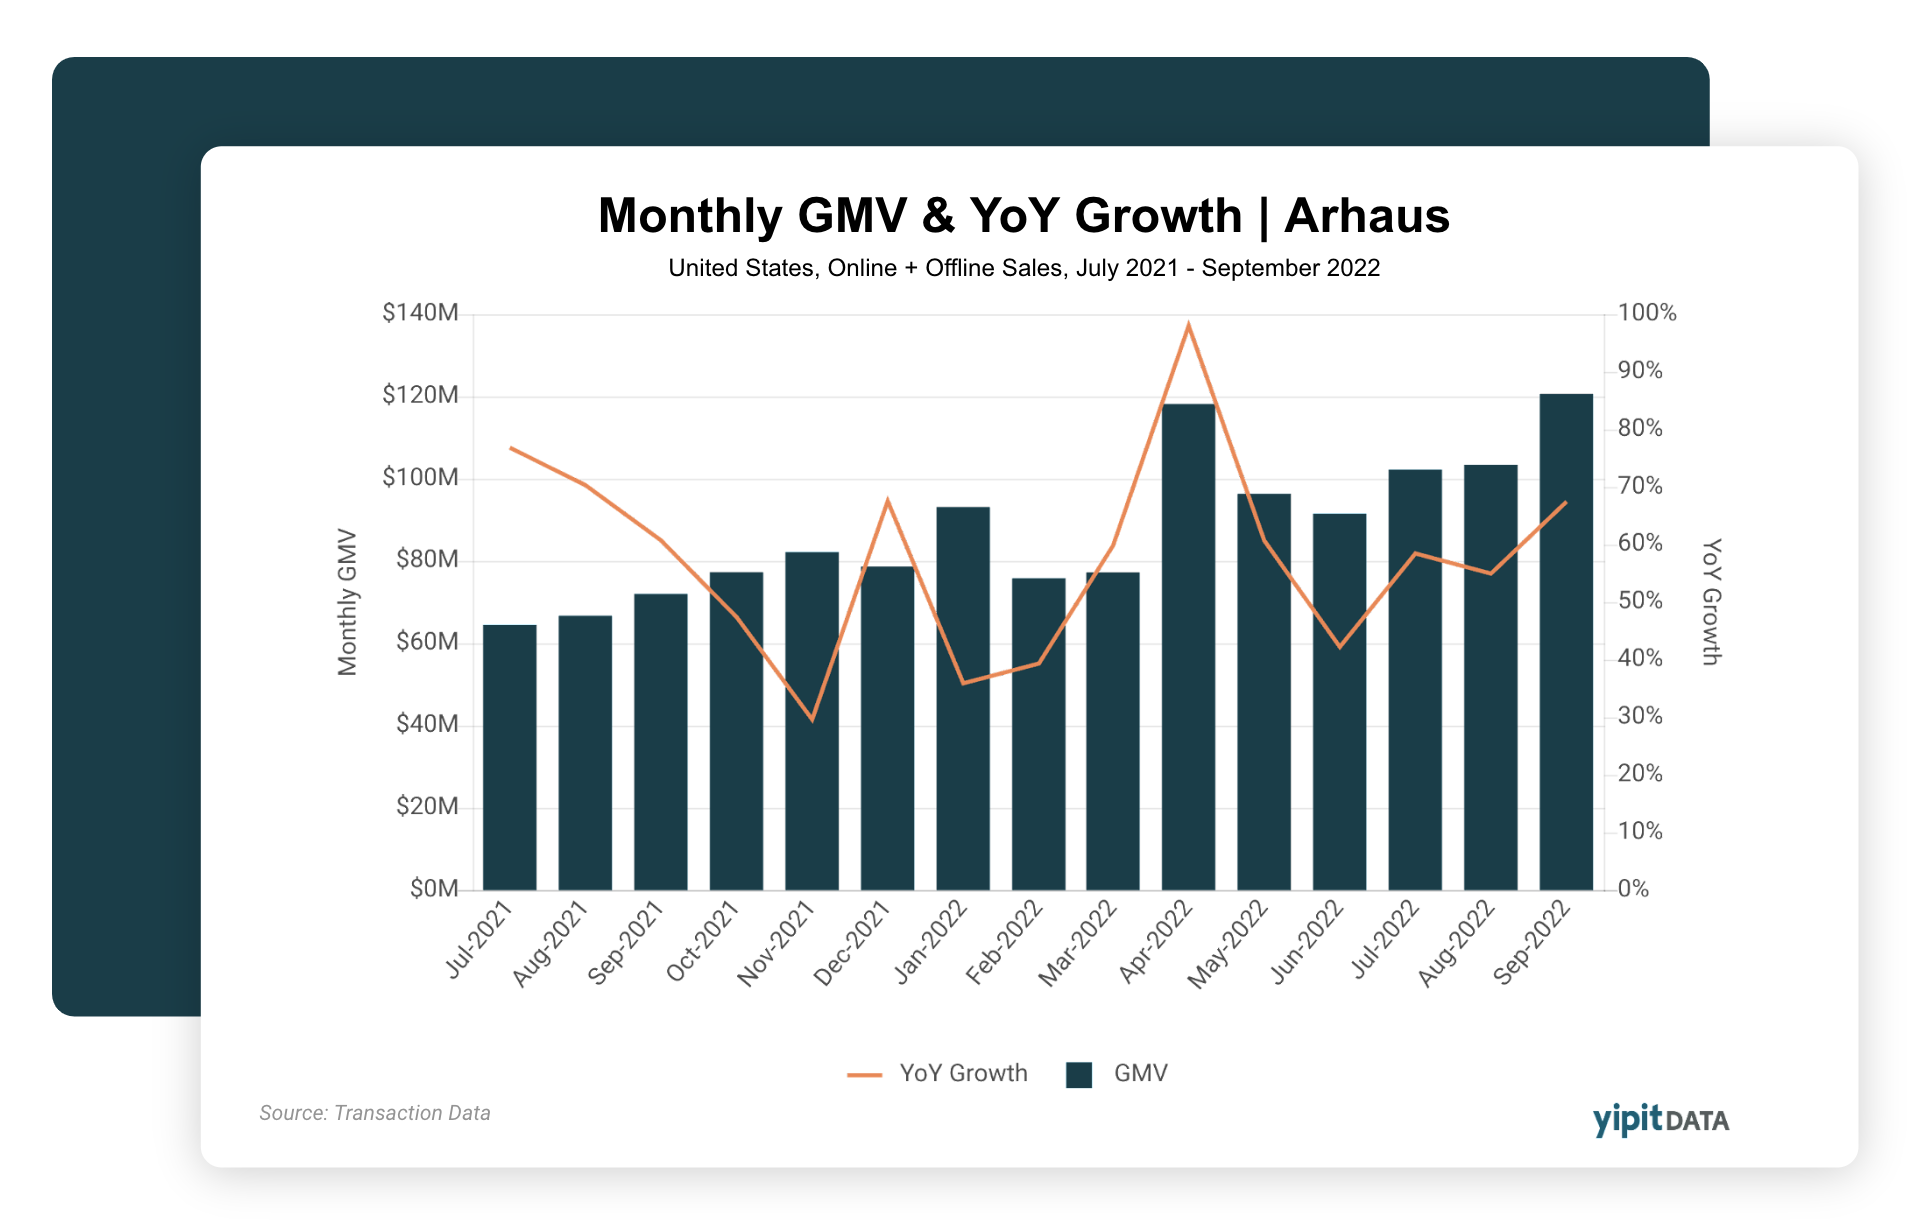
Strong YoY growth
Arhaus has seen consistent YoY growth in 2022, upwards of 55% in 3Q22.
September was its strongest month so far this year, exceeding $120M in monthly revenue
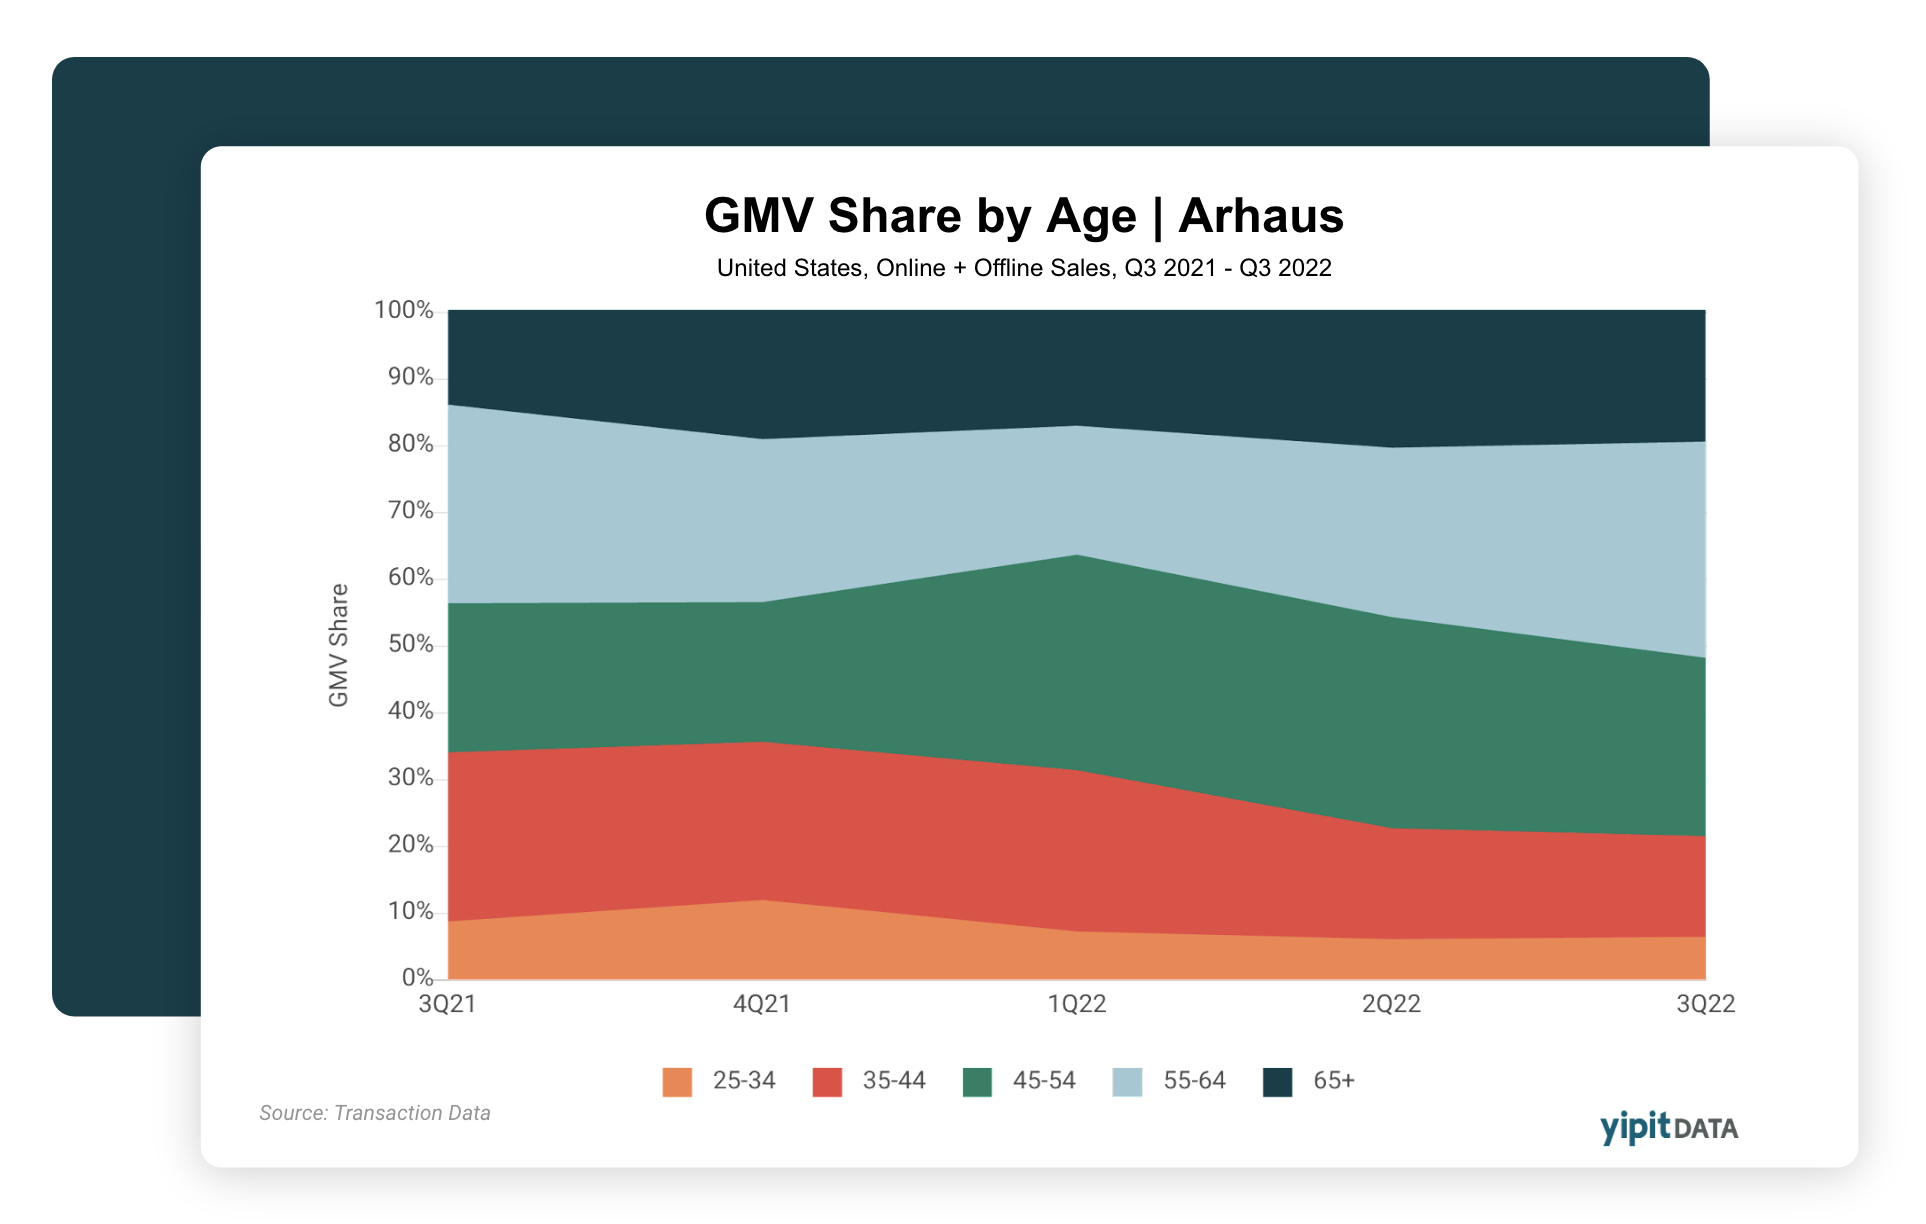
Shifts in Target Consumer
Older consumers are contributing a larger GMV share for Arhaus. Combined 3Q22 GMV share for these consumers was 47%, up from 36% the year prior.
As Arhaus successfully targets older consumers, millennials now only account for 1/5 of sales, a significant change from last year when they generated a third of Arhaus’ sales.
About YipitData
YipitData is a trusted data partner for over 480 of the world’s largest investment funds and companies. We give retailers & brands accurate and granular market share insights across channels and categories, helping them identify opportunities to outperform.
Index References
2Q22 Home Goods Market Share Index
Note about index methodology improvements: Since the release of our Q2 2022 report and our Q1 2022 report, the Home Goods Market Share Index methodology has been improved with refined coverage of brick-and-mortar transactions for all merchants. Our team analyzes billions of data points from transactions, email receipts, and web data and triangulates that data with publicly released sales estimates to ensure accuracy. This index is representative of online and offline sales within the U.S.