


*Crate & Barrel includes CB2 sales; Bed Bath & Beyond does not include subsidiaries Harmon Face Values + Buy Buy Baby
Does not include Amazon, Walmart, Target as this index is focused on the pure play retailers
Source: Transaction data
Published 2/14/23
A real-time, granular view of your digital market share and why it’s changing.
Interested in learning more?
Key Takeaways
Quarterly Insights
Industry Performance
How is the industry fairing overall? The home market continues to shrink: total home goods GMV declined 6% in 4Q22 YoY.
Has demand for home furniture and goods maintained or is it tapering? 2022 has been a tough year for the home goods industry with every quarter posting negative YoY sale growth ranging between -7% to -6%.

4Q22 Spotlight
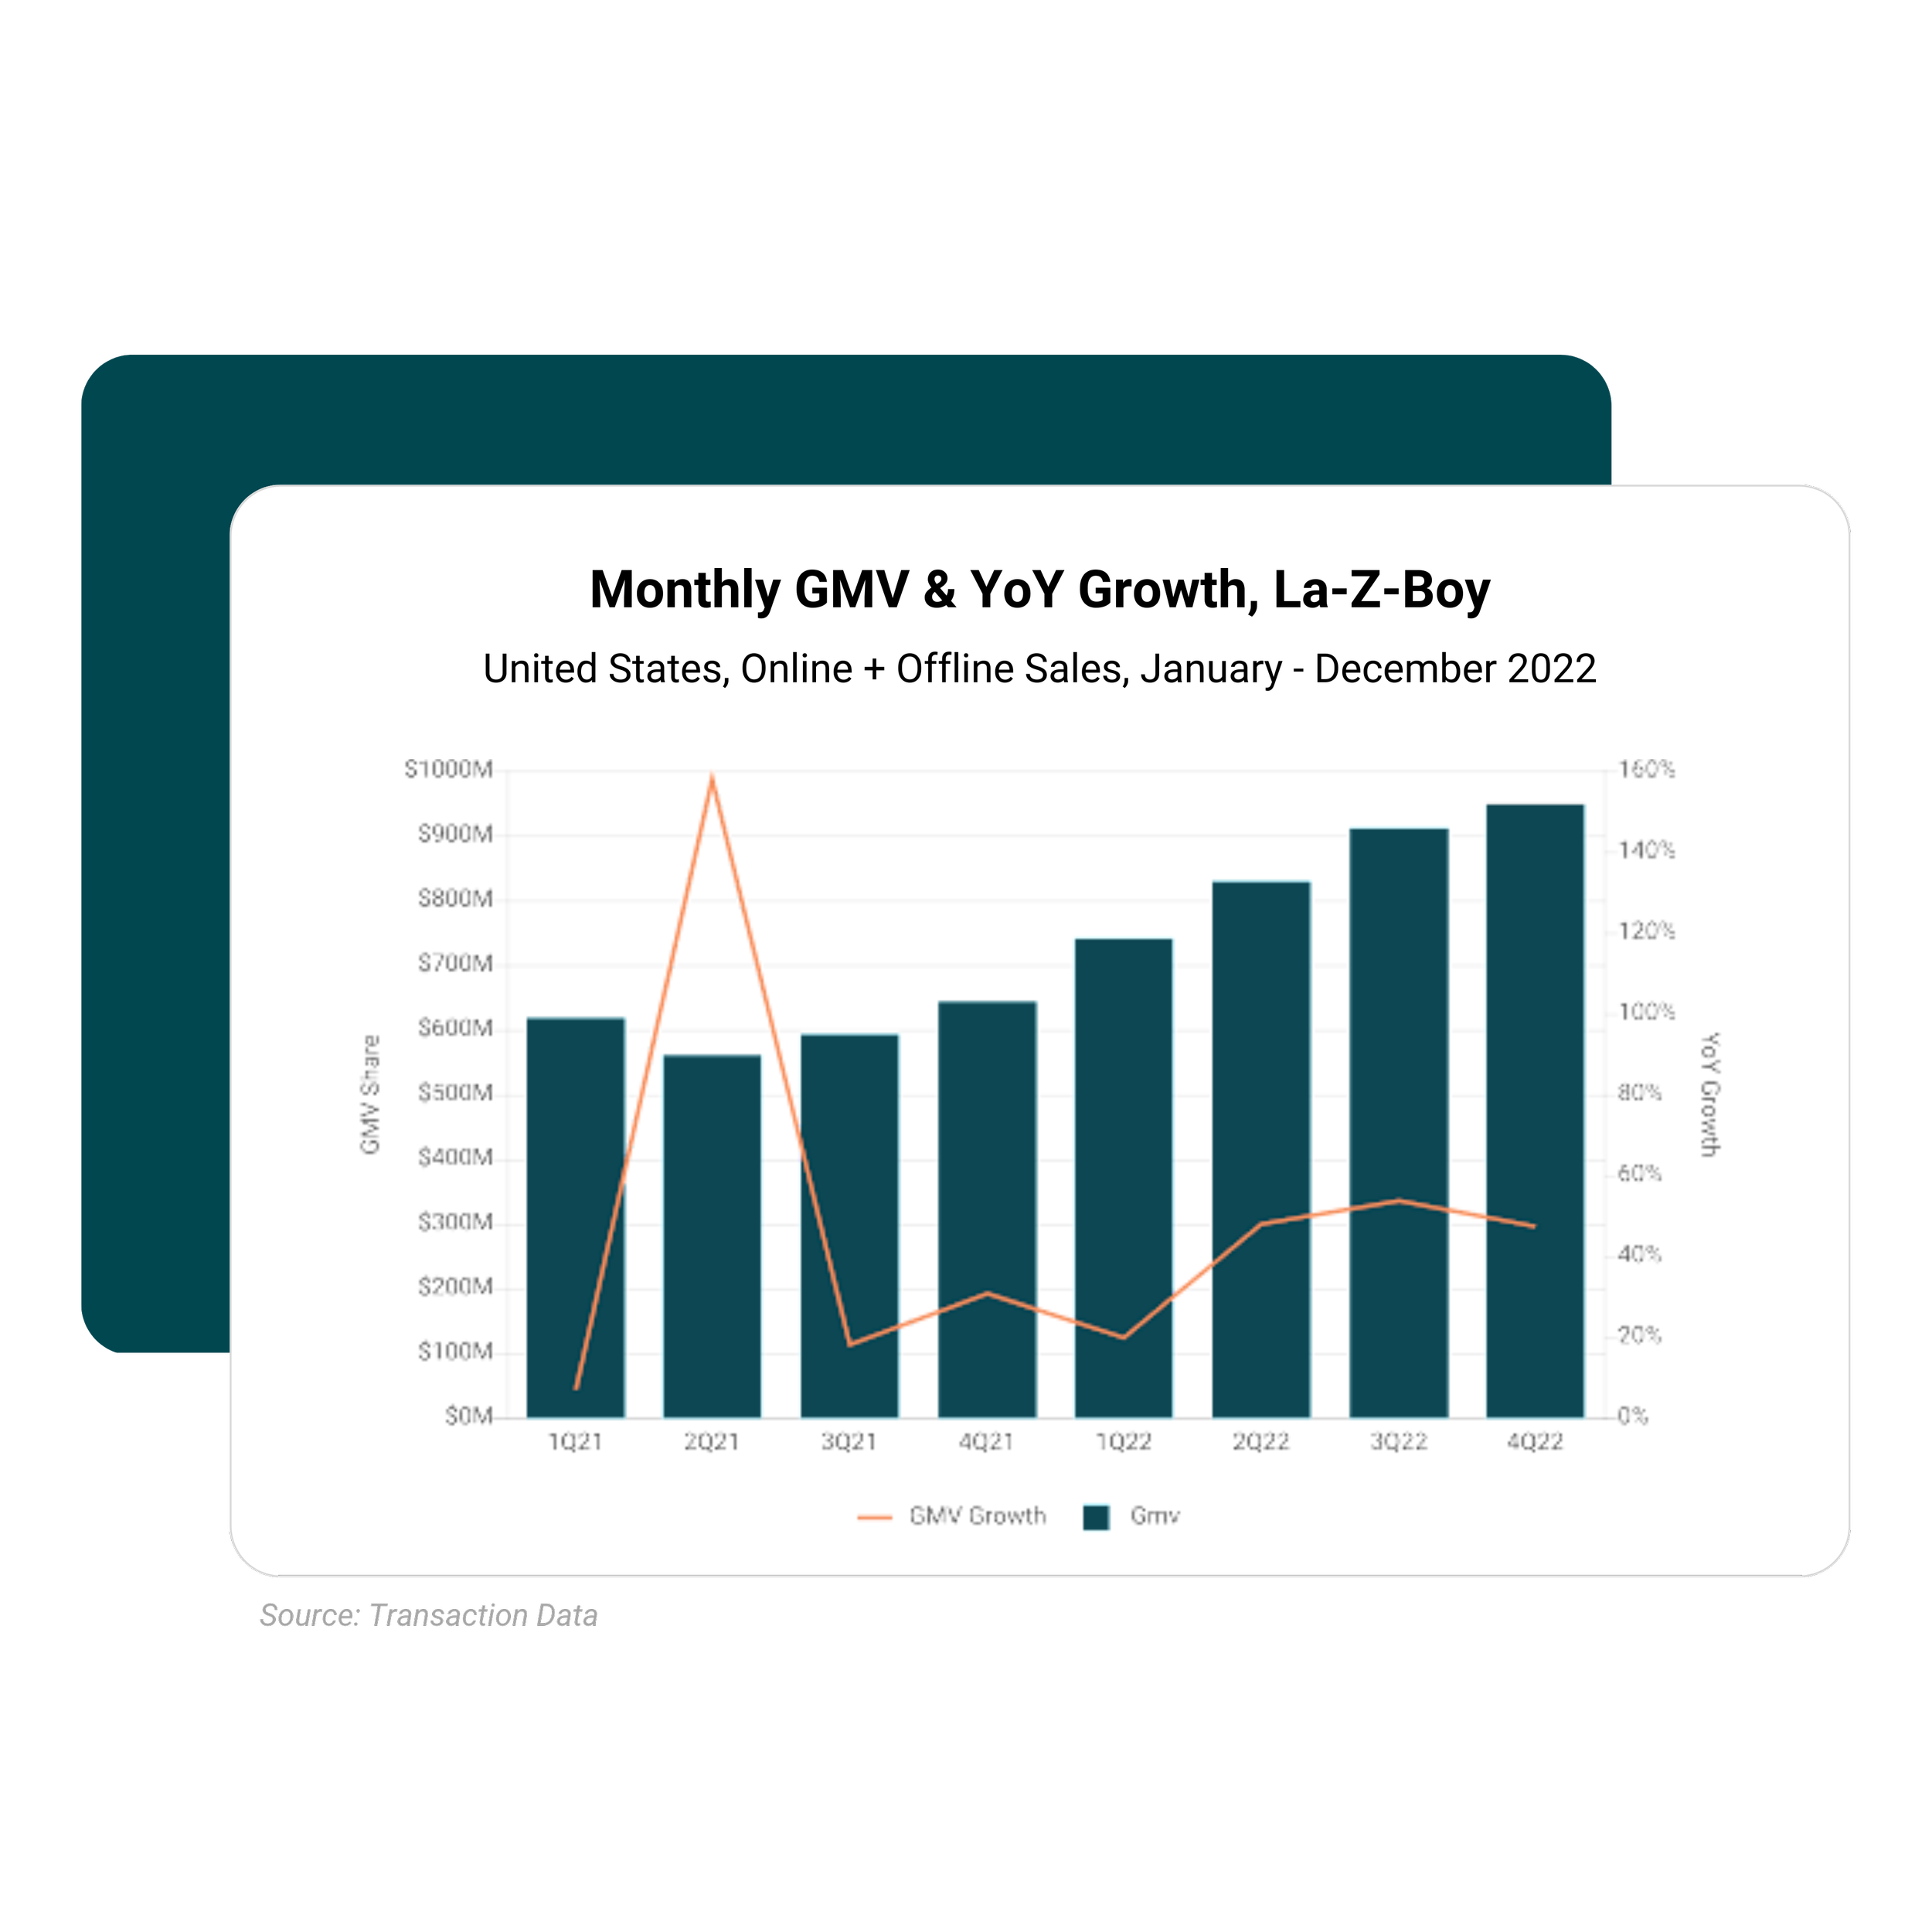
La-Z-Boy
Strong YoY GMV growth
La-Z-Boy has had record setting sales with GMV in Q4 2022 reaching almost $950 million and GMV growth at 47% YoY
Unlike the overall home goods market, La-Z-Boy has maintained positive sales growth for eight consecutive quarters.
Consumers 55+ driving GMV growth
56% of La-Z-Boy’s GMV in 2022 came from customers aged 65 years old and above. The age group with the second largest GMV share in 2022 were customers aged 55-64 years old with 24% GMV share. Altogether, consumers aged 55+ generated about 80% of La-Z-Boy’s GMV in 2022.
Despite fixed incomes sometimes limiting older consumers, those aged 55-64 and 65+ were the only two age groups that grew La-Z-Boy GMV in 2022.

About YipitData
YipitData is a trusted data partner for over 480 of the world’s largest investment funds and companies. We give retailers & brands accurate and granular market share insights across channels and categories, helping them identify opportunities to outperform.
Index References