Footwear Market Trends 2026: Running Shoes Drive Growth as Brand Share Shifts
By Devin Vaillant, Senior Insights Associate at @Yipitdata
Key footwear market trends in 2026: Running footwear grew +8.9% year-over-year while lifestyle declined -0.9%. In-store GMV rose +5.8% as online softened -1.3%. Nike lost share across both channels while Hoka, ON, New Balance, and Adidas gained ground. Market share is redistributing across retailers, with Amazon and Dick's Sporting Goods among the winners. Data is based on YipitData's transaction-level panel across major US footwear retailers.
The US footwear market is entering a new phase of growth defined by shifting consumer preferences, evolving retail dynamics, and increasing competition across brands. Recent transaction-level data from YipitData shows that while overall footwear growth remained modest in 2025, performance varied significantly across categories, channels, and brands.
Running footwear is emerging as a key growth driver. Lifestyle segments and direct-to-consumer strategies, on the other hand, are facing new headwinds. For retailers and brands navigating assortment decisions and distribution strategies, understanding where growth is concentrated — and where it is not — has become a competitive necessity.
Running Footwear Is Driving Category Growth
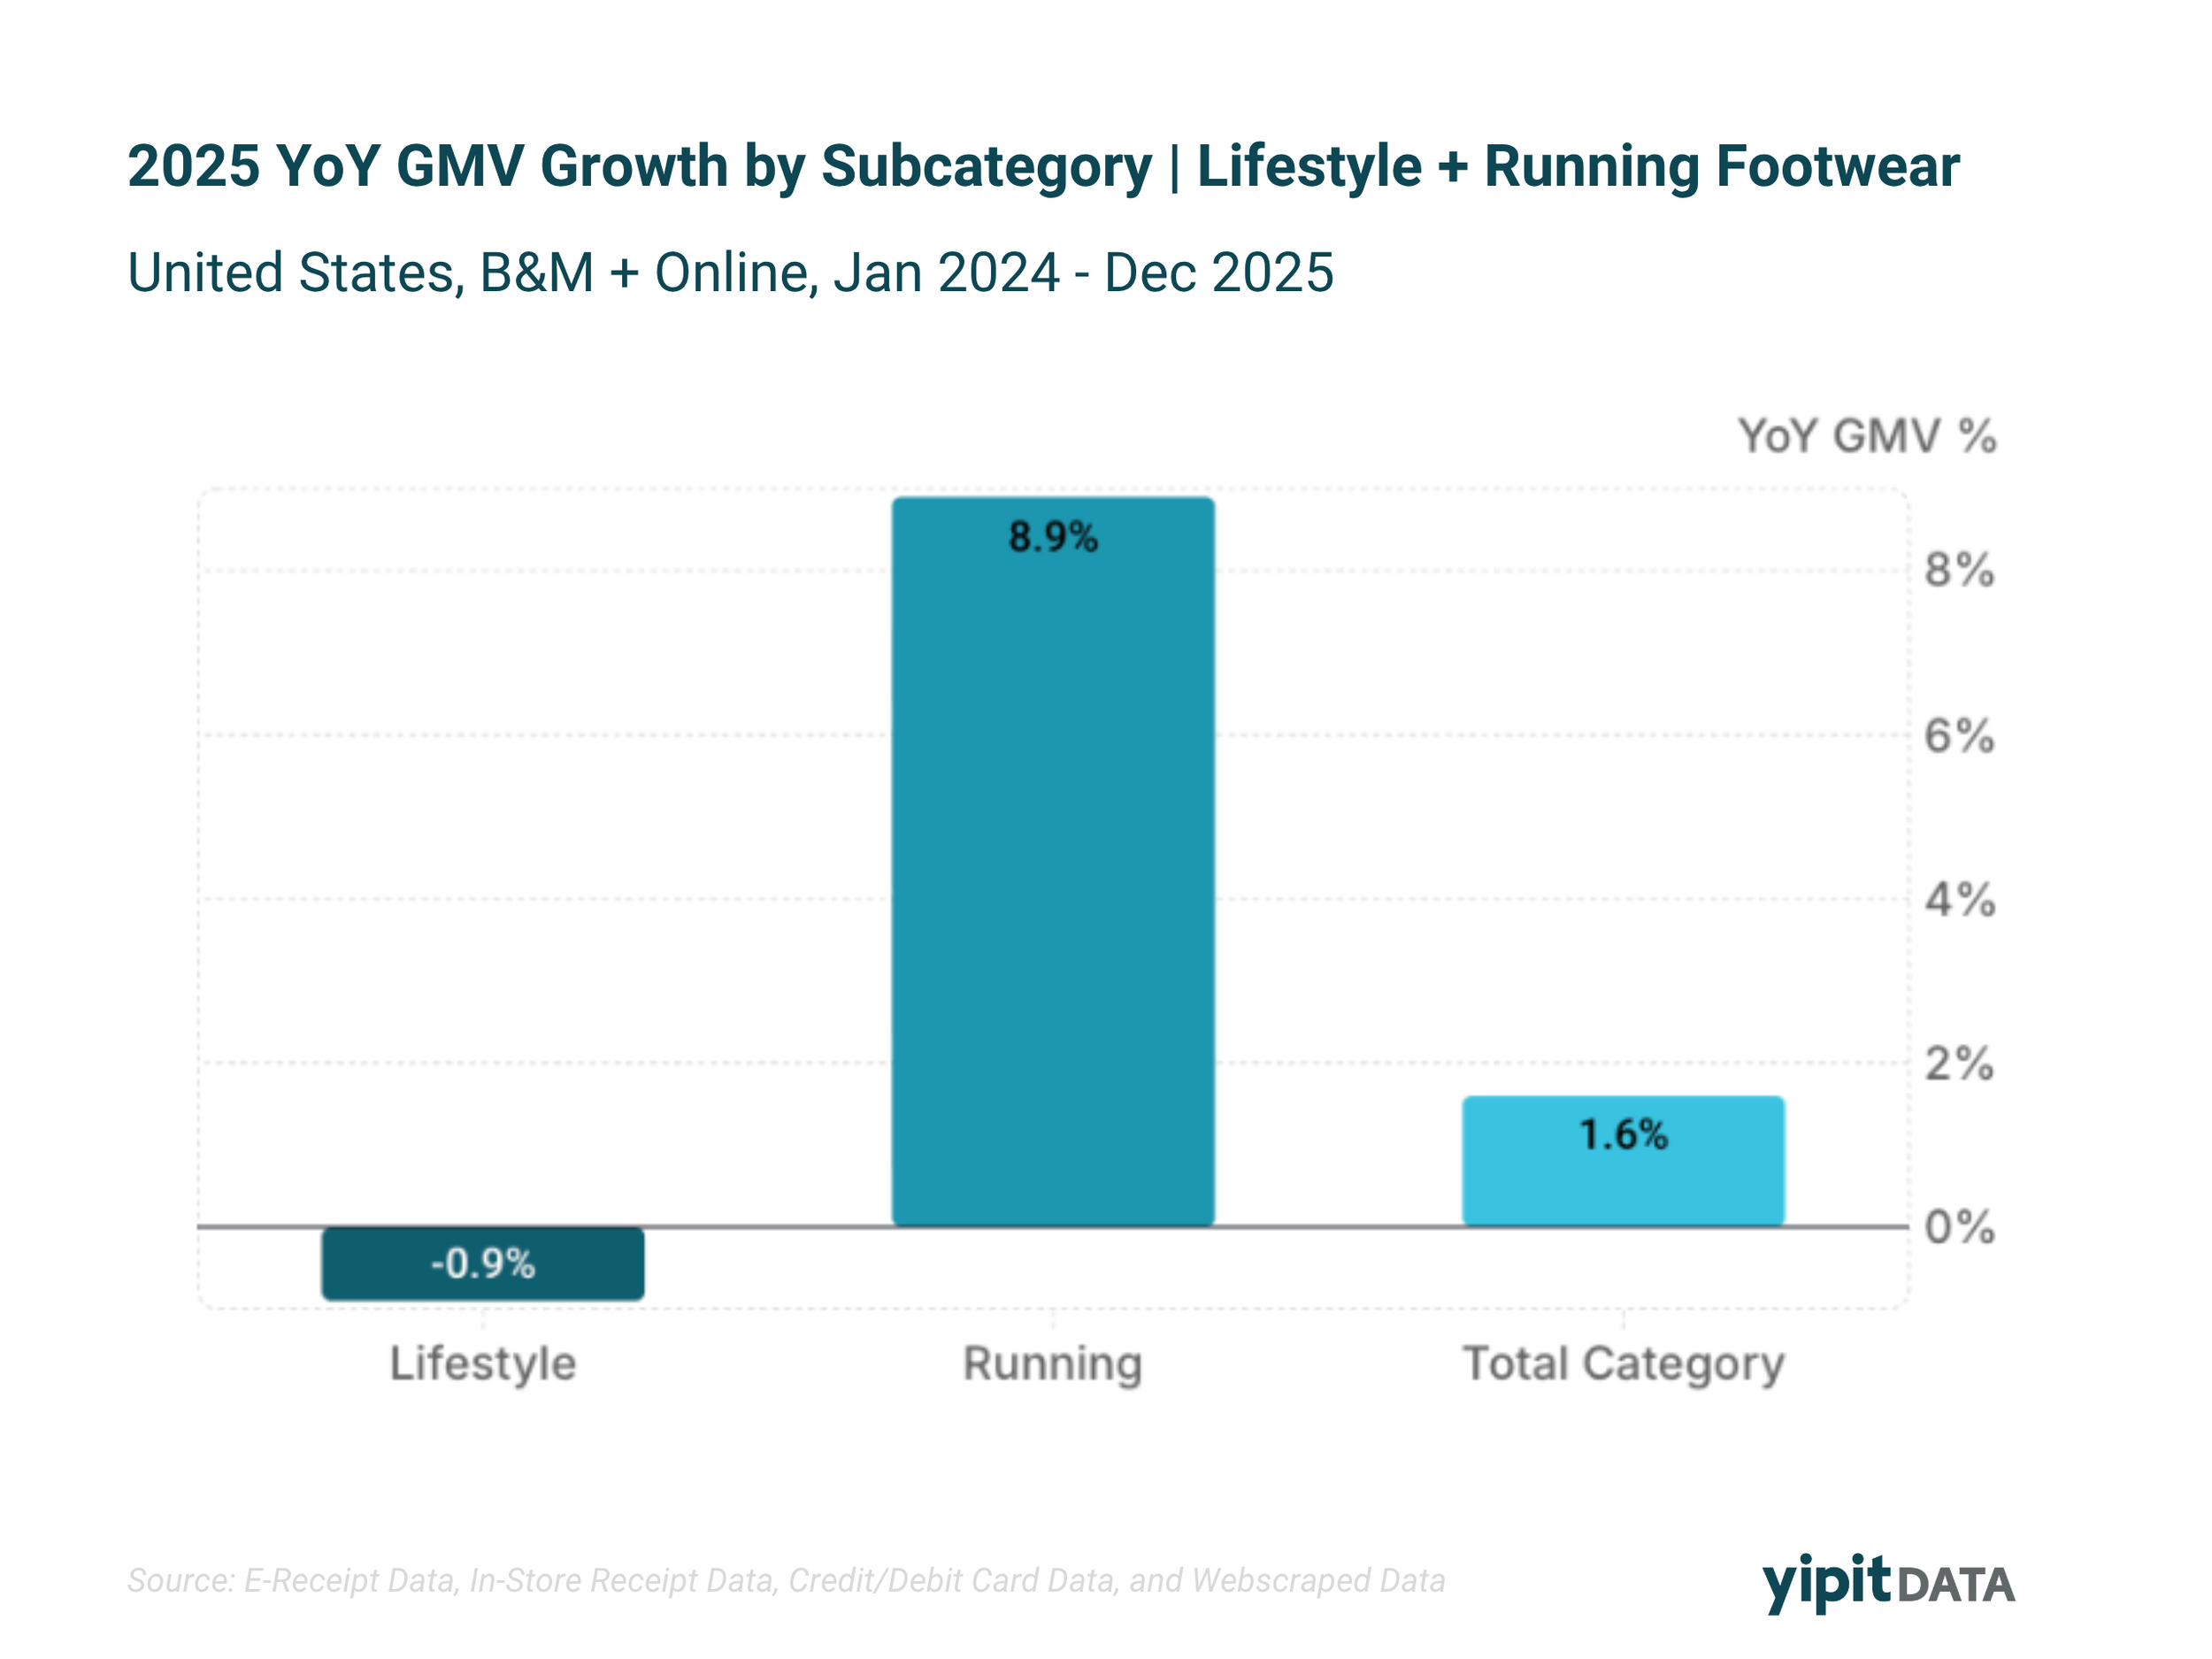
Growth in 2025 was not evenly distributed across the footwear market. Running footwear significantly outperformed lifestyle segments, highlighting a structural shift in consumer demand rather than a short-term spike.
Running footwear grew +8.9% year over year
Lifestyle footwear declined -0.9%
This divergence signals that category growth is increasingly concentrated in performance-driven products. For retailers, the implication is clear: assortment decisions that favor running and performance categories are better positioned to capture current consumer demand. Brands competing in the lifestyle segment face the harder task of defending flat-to-declining sell-through.
The performance trend is also creating tailwinds for specialty brands that have historically been niche players. Categories once dominated by lifestyle giants are now contested terrain.
In-Store Sales Are Rebounding While Online Softens
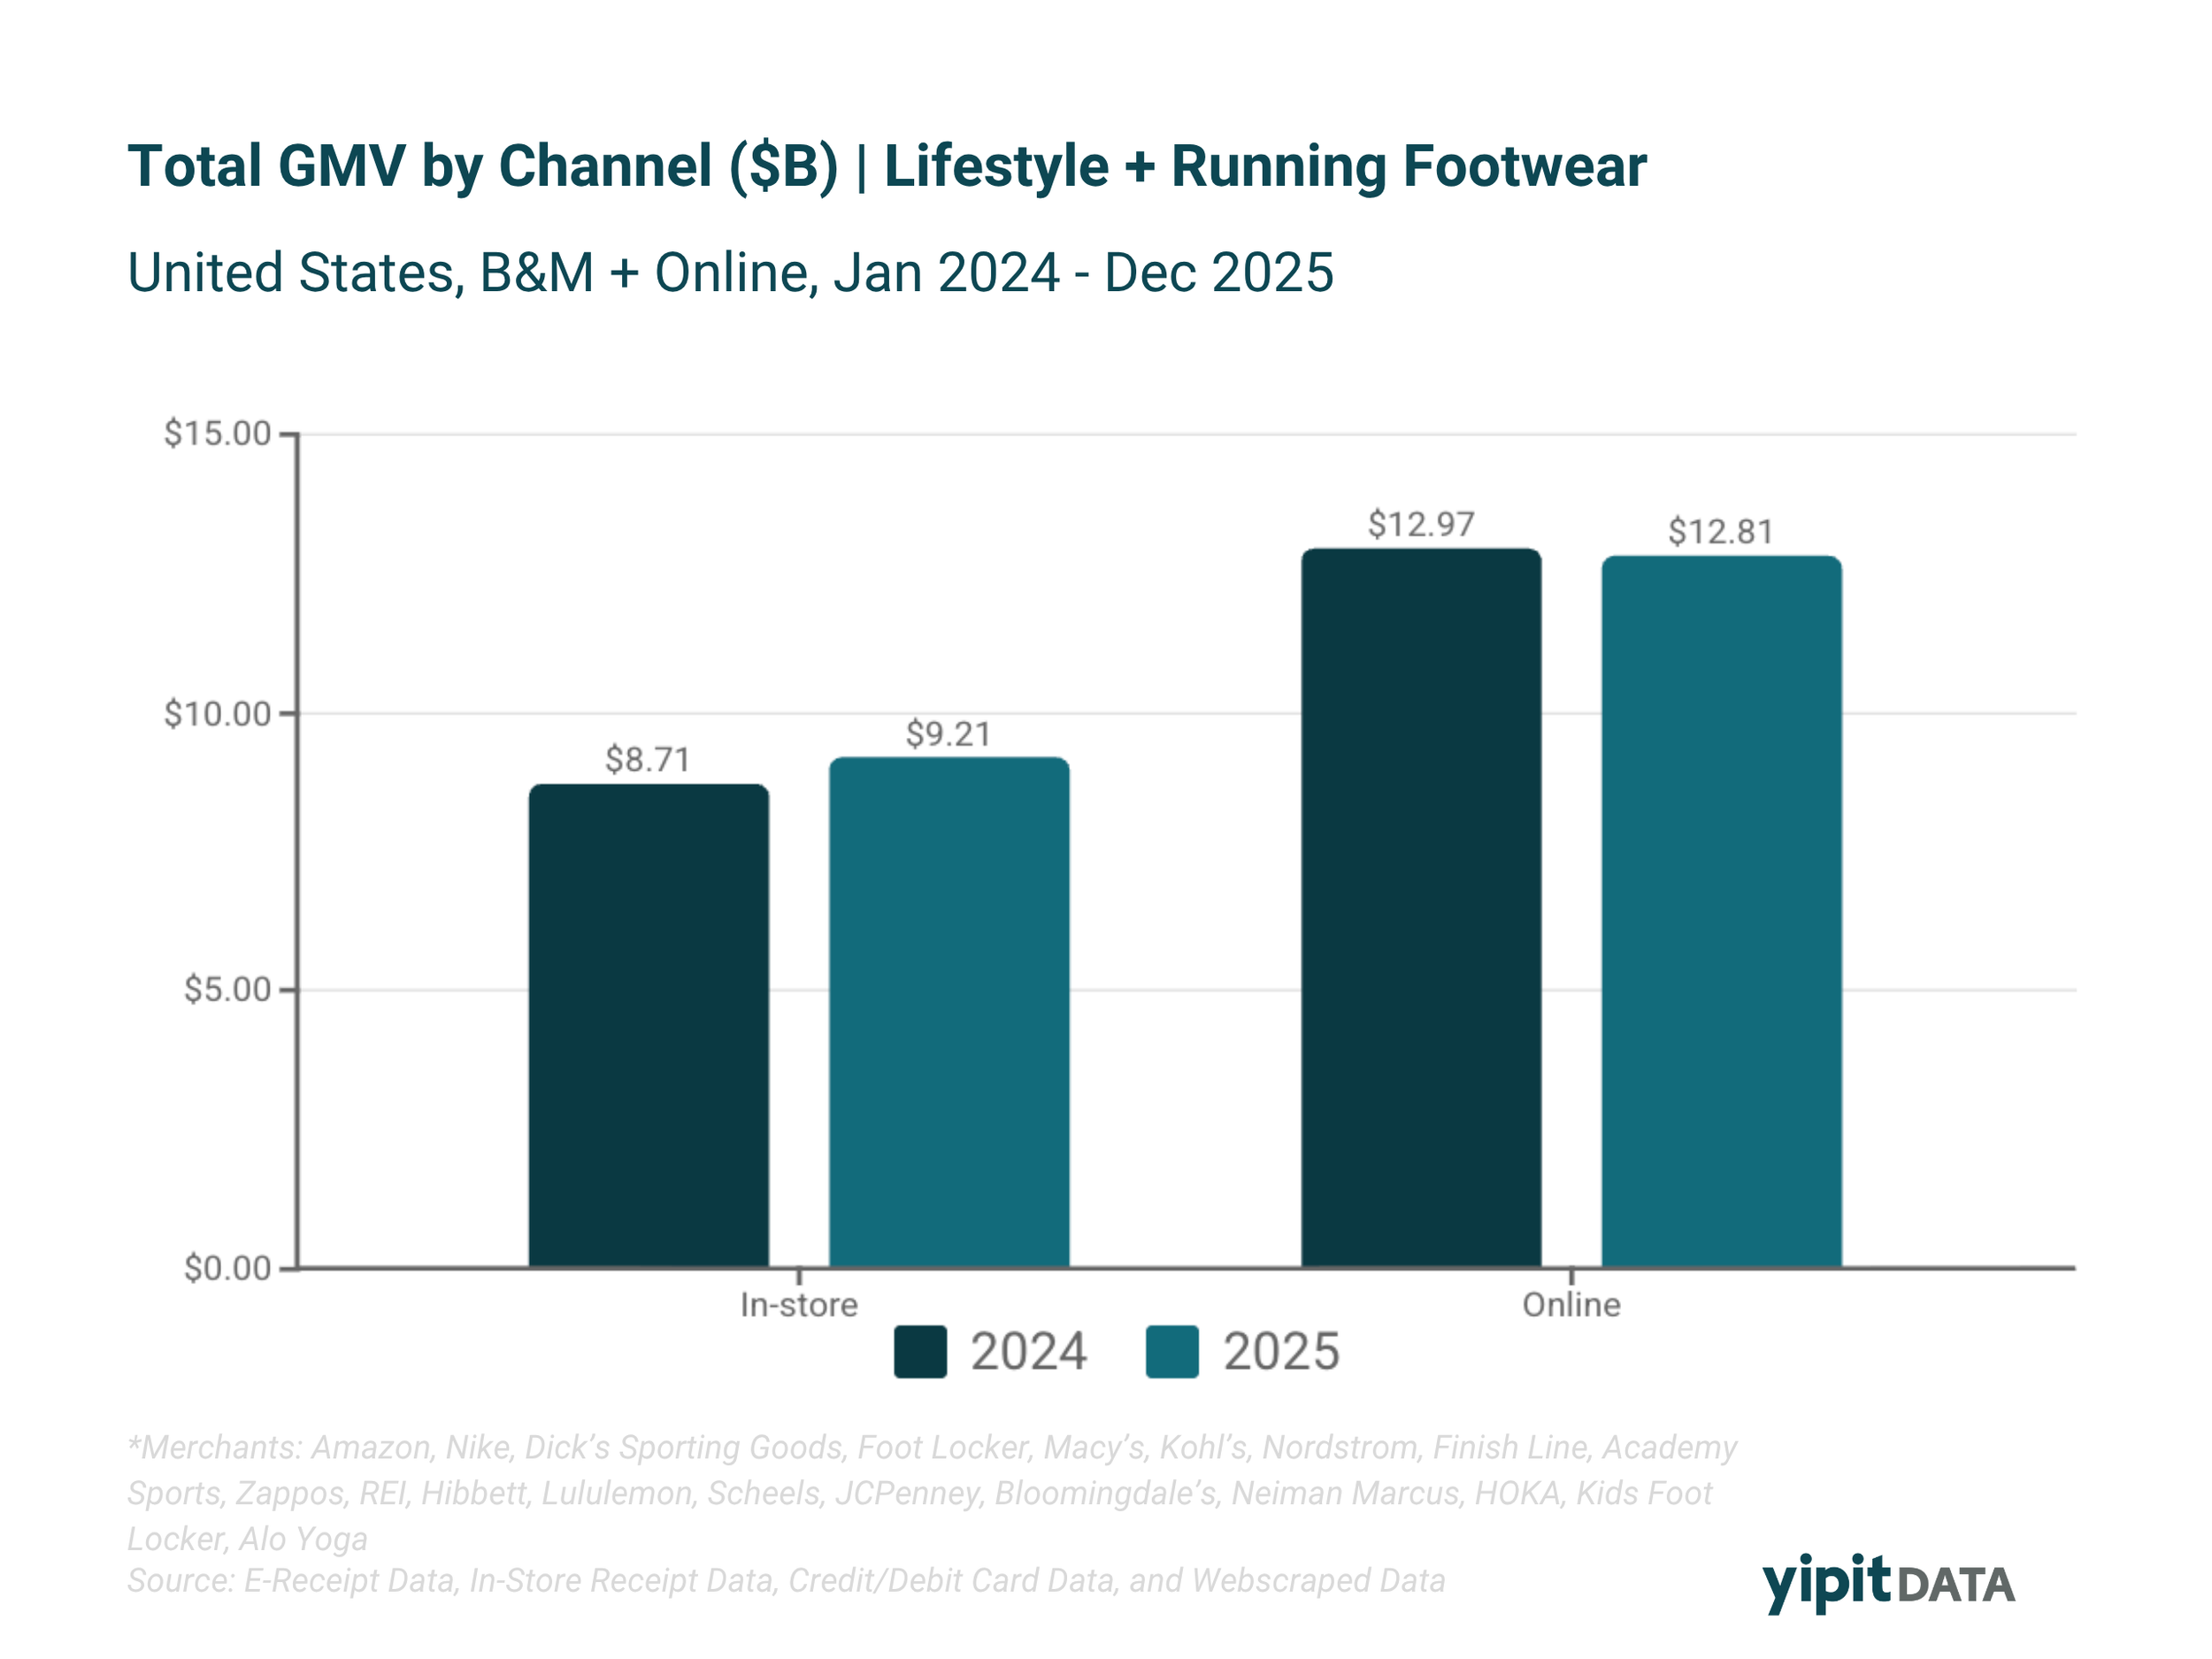
Channel performance diverged in 2025, with physical retail gaining momentum after years of e-commerce dominance.
In-store GMV increased +5.8%
Online GMV declined -1.3%
Despite these shifts, overall channel mix remained relatively stable. This suggests that growth is occurring within existing structures rather than through a major reallocation between online and offline — which means brands that have over-indexed on digital acquisition may need to reinvest in wholesale and in-store brand presence.
For retailers with strong store networks, the in-store rebound is an opportunity to reclaim traffic and conversion. For brands with heavy DTC exposure, it raises questions about channel mix optimization.
Market Share Is Shifting Across Retailers
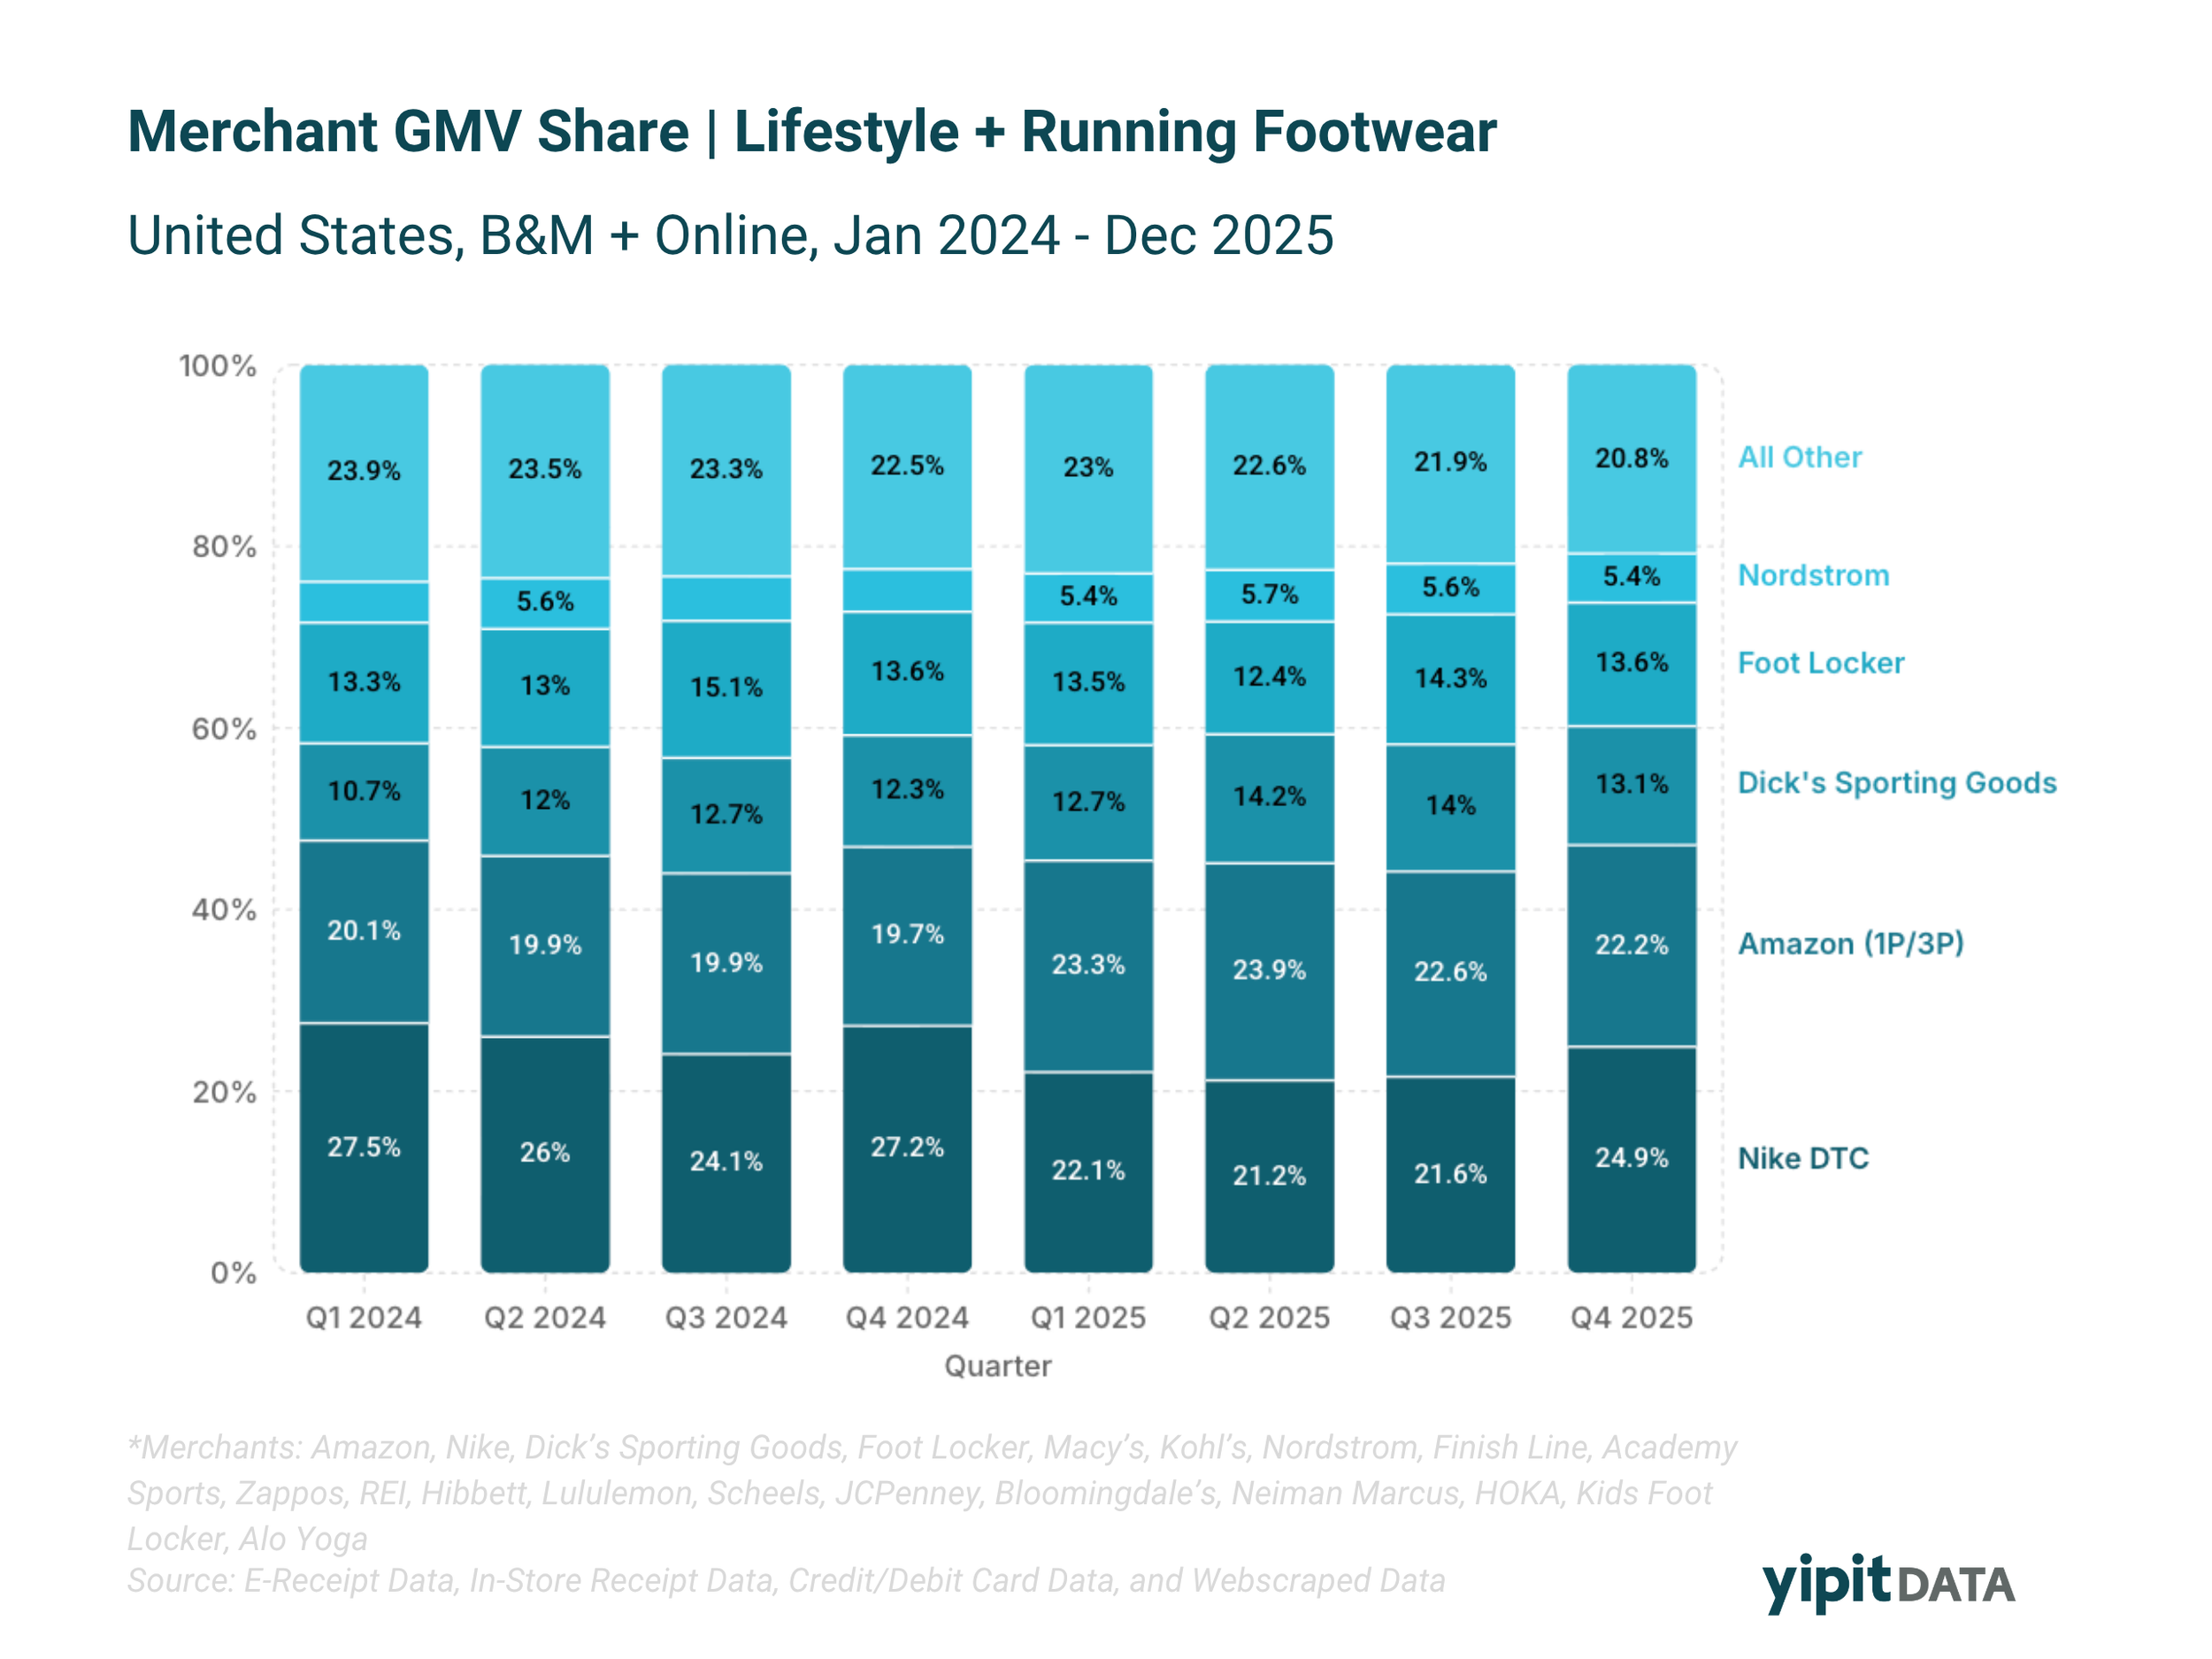
Footwear market share continued to redistribute across major retail partners in 2025. Marketplace and wholesale players gained share while direct-to-consumer channels declined.
Amazon and Dick's Sporting Goods were among the retailers gaining share, while Nike's direct channels trended downward. These changes reflect redistribution within the existing competitive set — not the emergence of entirely new players.
For footwear brands tracking distribution dynamics, the data shows a divergence between wholesale and DTC channel performance that continued through 2025, with wholesale and marketplace accounts capturing a larger portion of overall market share.
Nike Is Losing Share While Competition Fragments
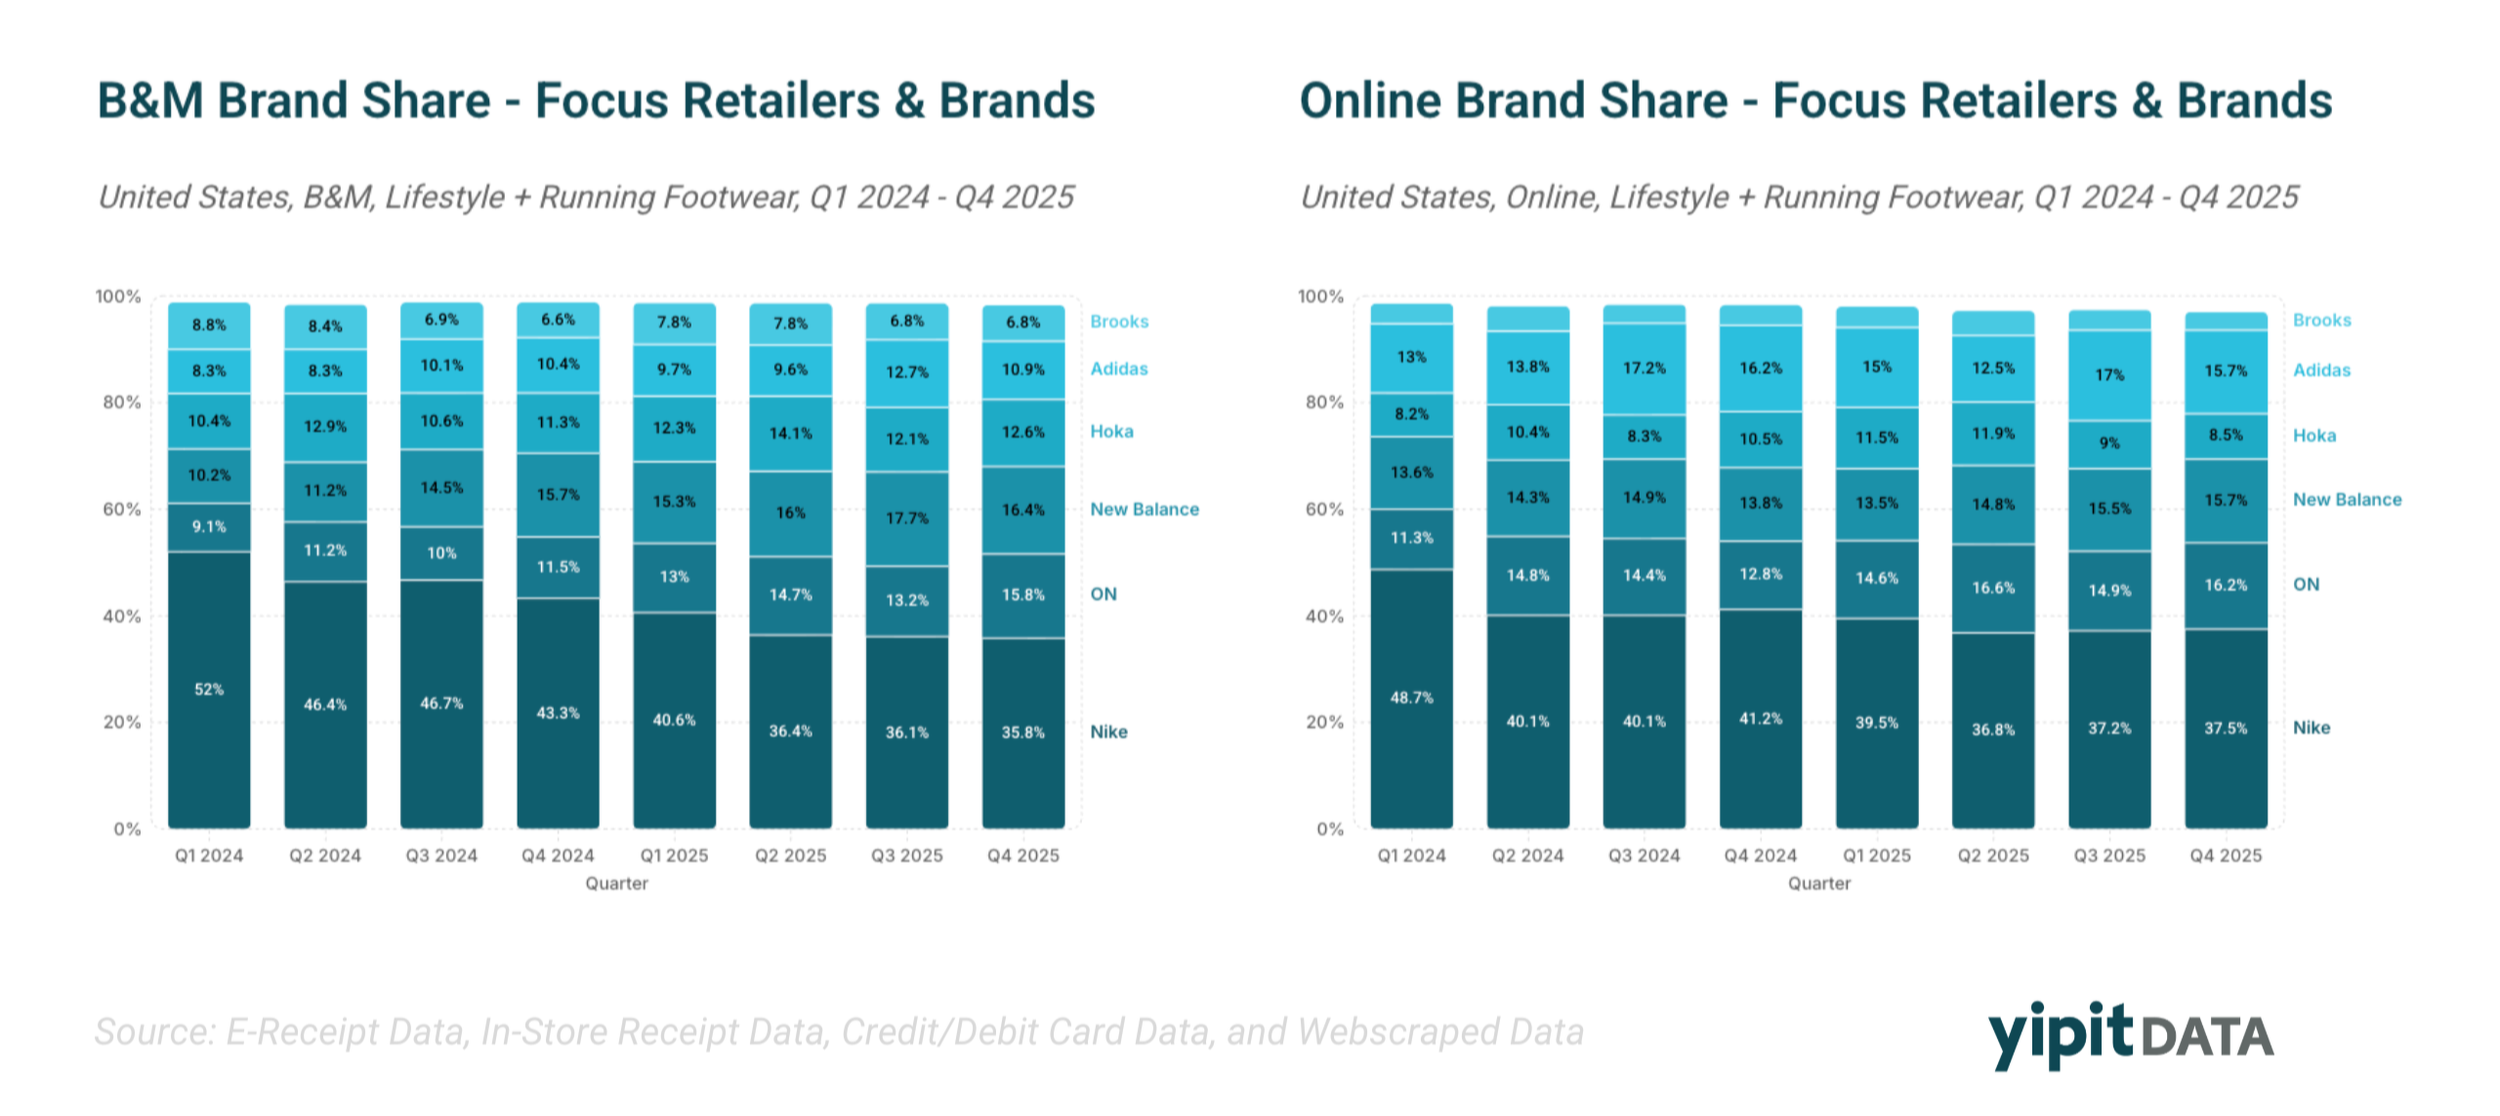
Nike's share declined across both in-store and online channels in 2025. Rather than consolidating into a single competitor, this share has shifted across multiple brands — indicating a more fragmented competitive landscape.
Brands participating in share gains include Hoka, ON, New Balance, and Adidas. The data shows that Nike's share loss is distributed across multiple challengers simultaneously, rather than representing a one-to-one transfer to a single brand. This fragmentation is reflected across both wholesale and direct channels, with the competitive set broadening as consumer demand disperses across a wider range of performance and lifestyle options.
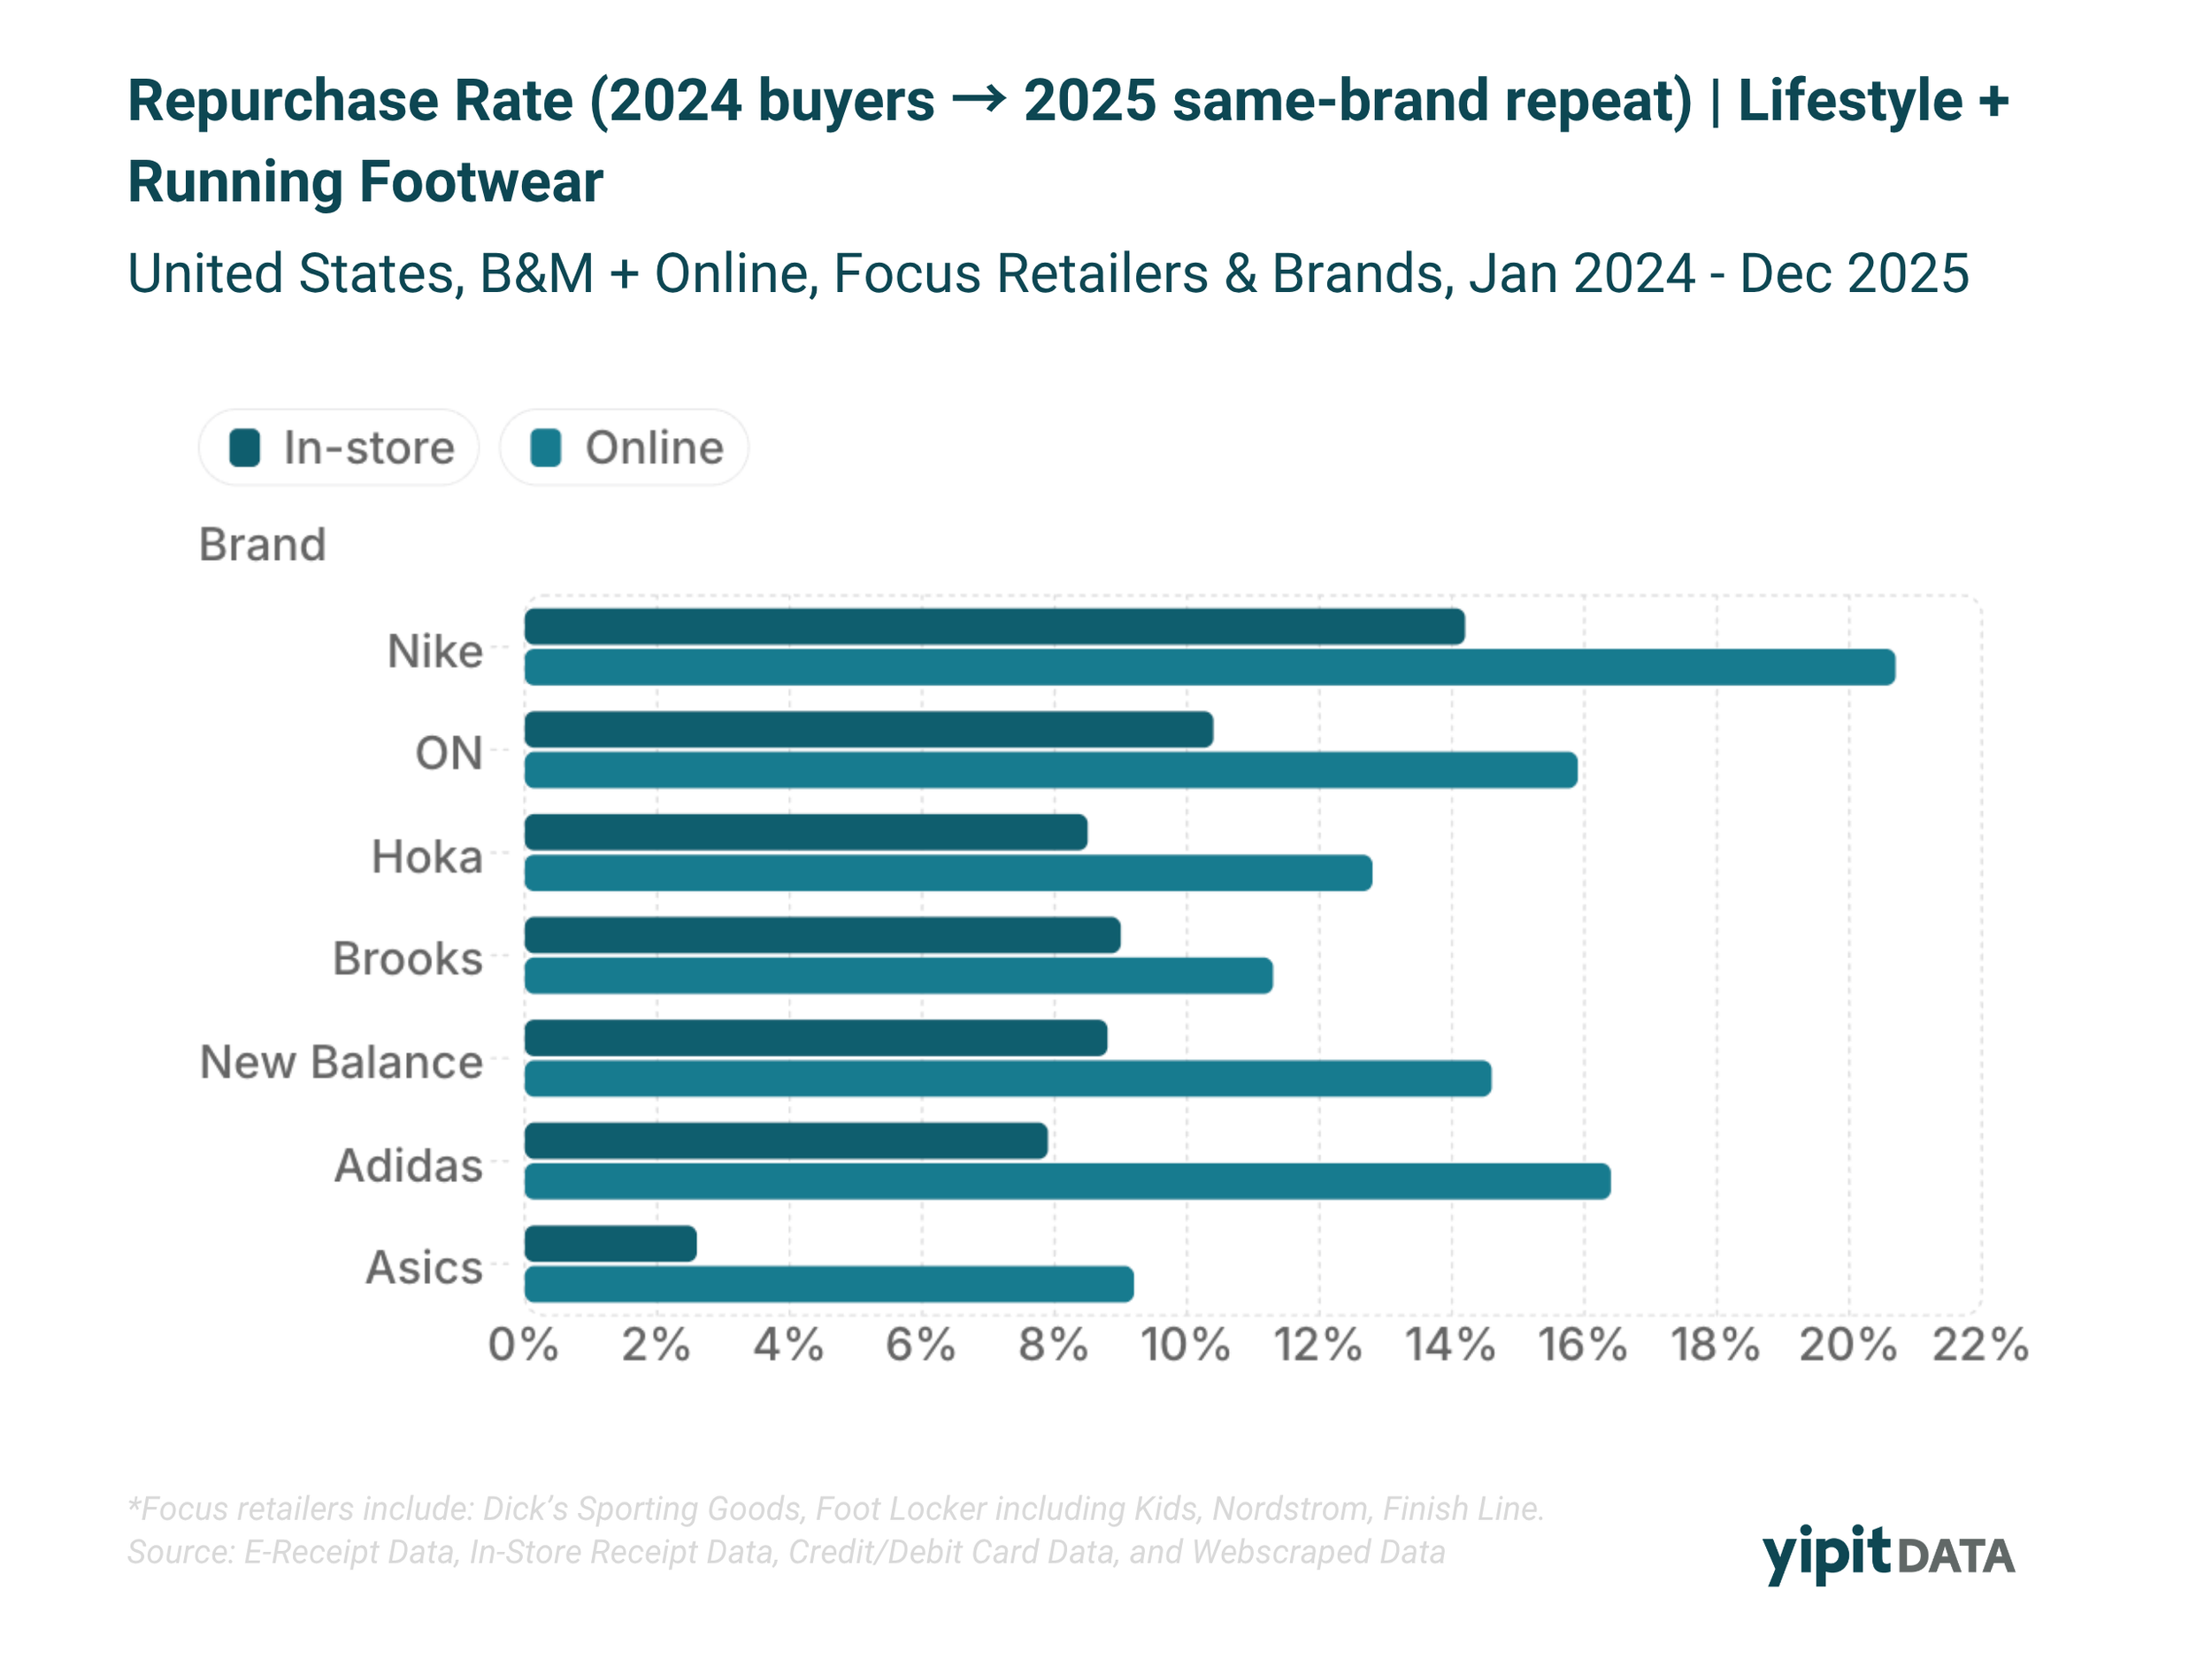
Customer Loyalty Varies Significantly by Brand
Retention metrics reveal meaningful differences in customer behavior across footwear brands — and these differences have direct implications for marketing spend efficiency and lifetime value modeling.
Nike leads in repurchase rates across channels
ON, Adidas, and New Balance follow at lower but comparable levels
Hoka, Brooks, and Asics trail further below in repurchase frequency
A similar pattern appears in share of wallet: Nike retains approximately half of customer spend, while other brands capture smaller portions. The data indicates that despite losing overall market share, Nike maintains a distinct retention advantage over challenger brands including Hoka, ON, New Balance, Adidas, Brooks, and Asics.
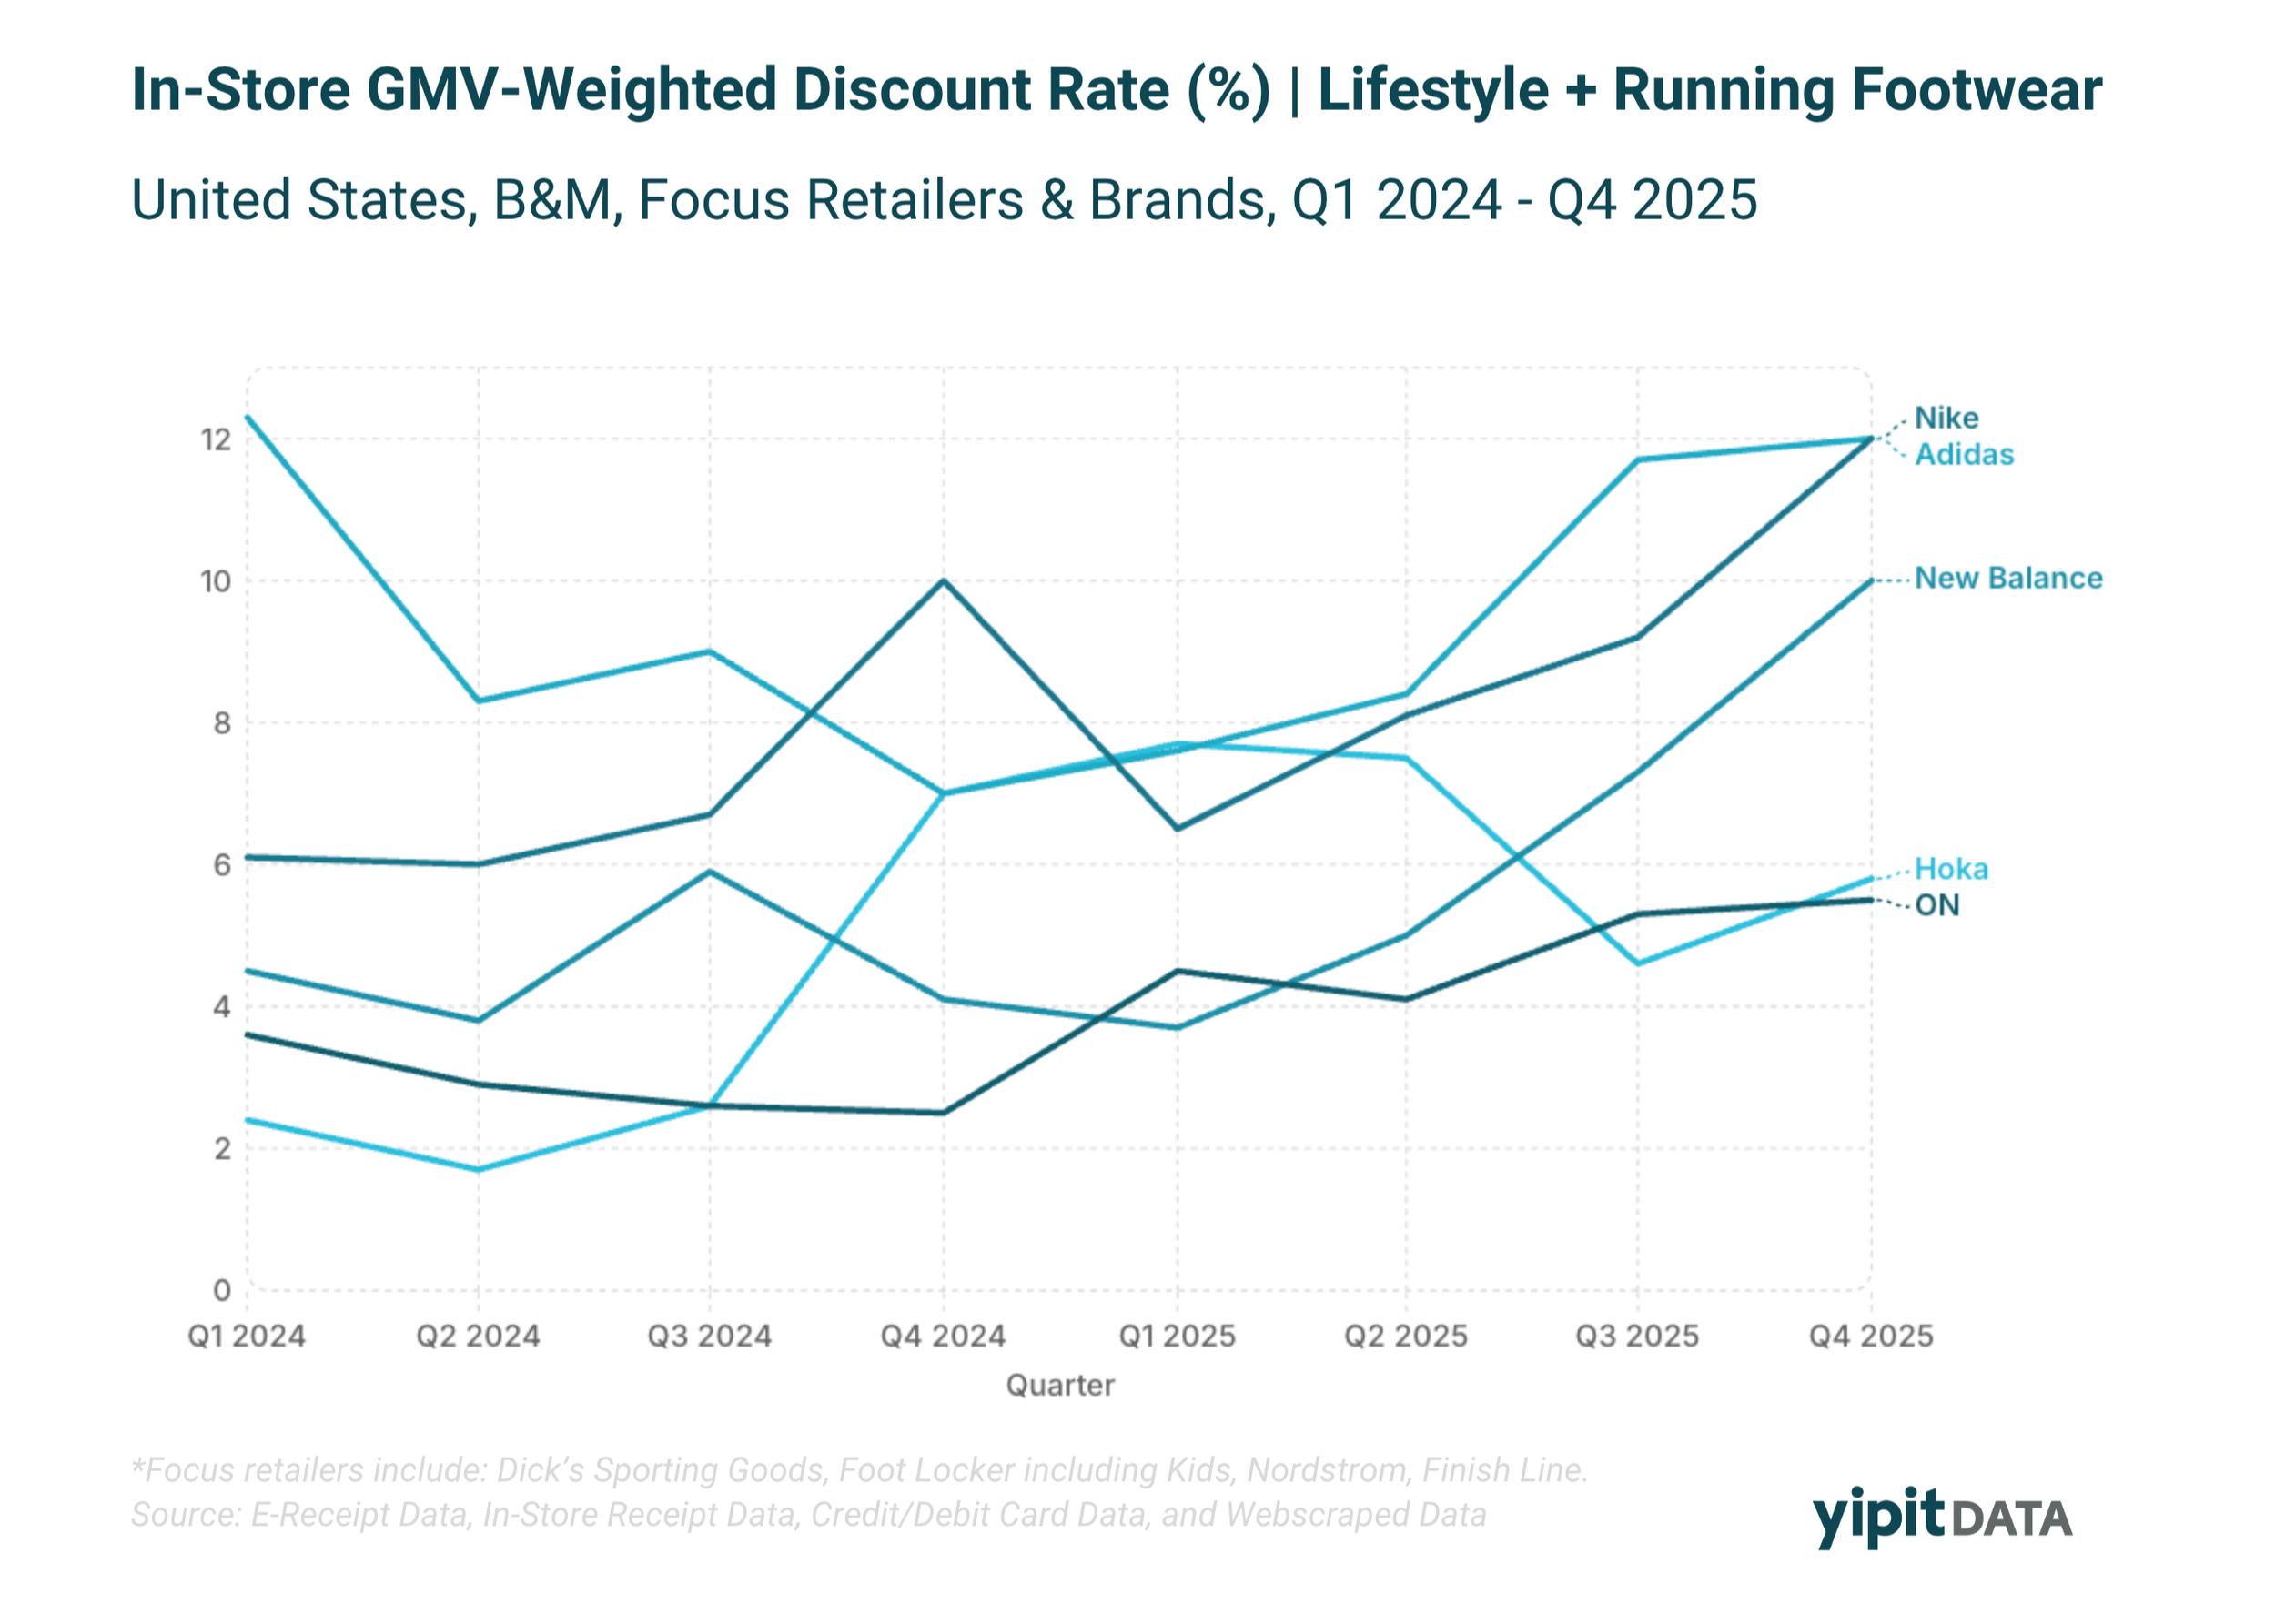
Discounting Increased Across the Market
Promotional activity expanded in 2025, particularly among major brands, adding complexity to pricing strategy decisions.
Nike, Adidas, and New Balance increased discounting levels
ON maintained lower discount rates relative to peers
The data shows a divergence in pricing approaches across the market, with ON's premium pricing position coexisting alongside share gains in the running segment — a pattern that stands out against the broader trend toward increased promotional activity.
2025 footwear market trends: key takeaways
The footwear market in 2025 shows a clear shift in where growth is concentrated. Running footwear outperformed while lifestyle softened. In-store gained momentum relative to online. Market share redistributed across both retailers and brands, with Nike losing ground to a fragmented set of challengers including Hoka, ON, New Balance, and Adidas.
Variation in customer retention and pricing strategies adds further complexity to the picture — with Nike maintaining a retention advantage even as its overall share declined, and ON sustaining premium pricing while gaining share in the running segment.
Understanding these shifts requires a detailed view of consumer behavior and channel dynamics. If you're looking to go deeper into footwear and apparel trends, or see how these changes impact your specific business, reach out to a YipitData analyst.
About this data
YipitData tracks consumer spending across the US footwear market using an aggregated, anonymized panel of millions of transactions. Data covers both direct-to-consumer and wholesale channels across major retailers including Amazon, Dick's Sporting Goods, Nike.com, and other key footwear destinations.
All figures in this report reflect full-year 2025 performance unless otherwise noted.
YipitData is not a registered investment adviser and does not sell securities.
FAQ’s
-
YipitData provides detailed market and shopper insights across apparel categories, including footwear, outerwear and activewear. Using transaction-level data, YipitData helps brands and retailers understand market share, category growth, and changing shopper behavior.
-
Apparel and footwear data analytics can help brands understand category growth trends, identify shifts between online and in-store sales, track brand performance, and analyze customer retention. These insights are commonly used to monitor competitive positioning, evaluate pricing strategies, and understand changes in consumer spend across segments like running and lifestyle footwear.
-
YipitData measures market share in apparel and footwear by analyzing aggregated transaction data across major retailers and brands. This includes both direct-to-consumer and wholesale channels, allowing for a comprehensive view of how market share shifts over time across key players like Nike, Adidas, and emerging brands.
-
Apparel and footwear brands can use data analytics to identify growth opportunities by analyzing category trends, tracking shifts in consumer demand, and monitoring performance across channels. Data can highlight which segments, such as running footwear or premium apparel, are growing faster, as well as where brands are gaining or losing share. This helps companies prioritize product categories, optimize distribution strategies, and better align with changing consumer spending patterns.