State of the Pure Play Home Goods Industry
The Home Goods Retail space exploded during the pandemic with an increase in consumer demand for home office furniture and other home goods. YipitData’s research team recently dove deep into the Home Goods market, looking at the top 30 pure players to share out 3 key takeaways on market share, average order frequency, and customer retention.
For a quarterly snapshot of the pure play home goods retail landscape, including top 30 winners and losers by GMV market share, check out YipitData’s newly released Home Goods Market Index.
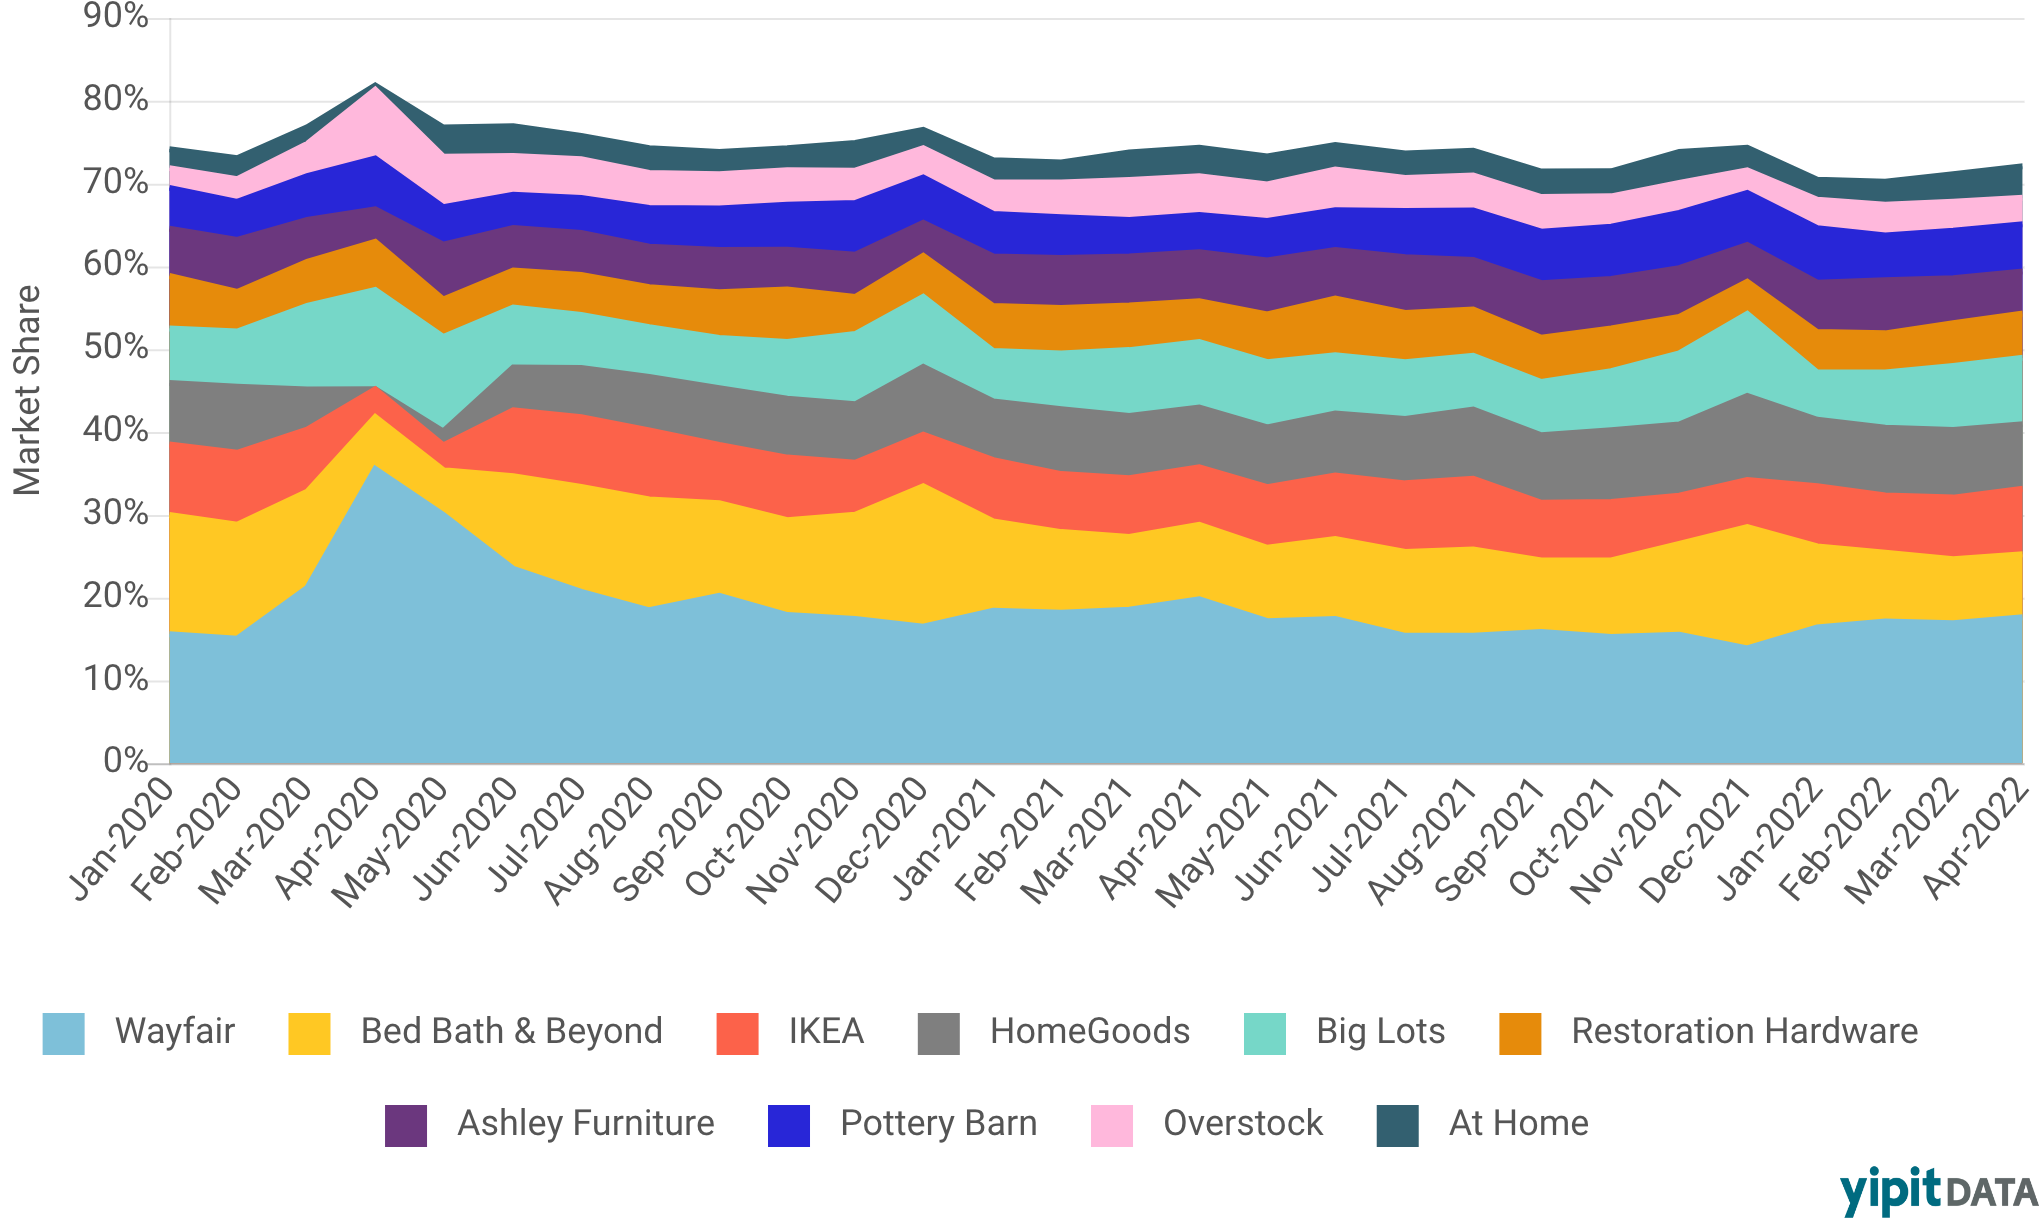
Wayfair holds strong as leader, even with slight decline YoY
Despite Wayfair’s incredible success at the start of the pandemic, claiming over a third of market share (35.5% in April 2020), their hold on the market has slipped to 16.7% in 1Q22. On the flip side, HomeGoods’ market share has shifted dramatically from April 2020 to April 2022. After closing all of its stores for 45 consecutive days at the beginning of the pandemic, HomeGoods’ market share dropped to 0% in April 2020. However the discount retailer has since rebounded to 7.8% in April 2022, reclaiming their pre-pandemic position. Looking at the market as a whole, as smaller players continue to recapture more of the market, the share of GMV from the top 10 brands has steadily declined (from over 80% of total GMV in April 2020).
Monthly Market Share
Top 10 Brands, United States | January 2020 - April 2022
Average order frequency of the top 10 retailers declining
With the exception of Ashely Furniture, average order frequency (AOF) for the top 10 retailers dropped. Restoration Hardware and Pottery Barn had the highest AOF in 1Q2022, followed by discount retails HomeGoods and Big Lots with the average customer ordering over 1.5 times per quarter. Declining AOF may be reflective of a decline in consumer demand for home goods, industry challenges with supply chain disruption, and/or a resurgence of smaller players like Ethan Allen, Arhaus and CB2 claiming more of the home goods market.
Average Order Frequency YoY
Top 10 Brands, United States | 1Q2021 vs 1Q2022

Quarterly customer retention declining across all retailers
All retailers experienced a drop in their quarterly customer retention YoY for 1Q 2022 which could be reflective of a decrease in consumer spending and/or consumers diversifying where they shop. HomeGoods and Big Lots have very strong customer retention rates. HomeGoods retained about a third (32.1%) of its customers in 1Q2022 and Big Lots’s customer retention was 29.4% for the same quarter. Restoration Hardware saw the biggest change in its customer retention rates from 27.5% in 1Q2021 to 22.0% in 1Q2022. This drop in customer retention correlates to Restoration Hardware’s -9.5% decline in market share YoY for 1Q2022.
Quarterly Customer Retention YoY
Top 10 Brands, United States | 1Q2021 vs 1Q2022

Interested in connecting with our analysts to learn more about the evolving shifts in the home goods market?