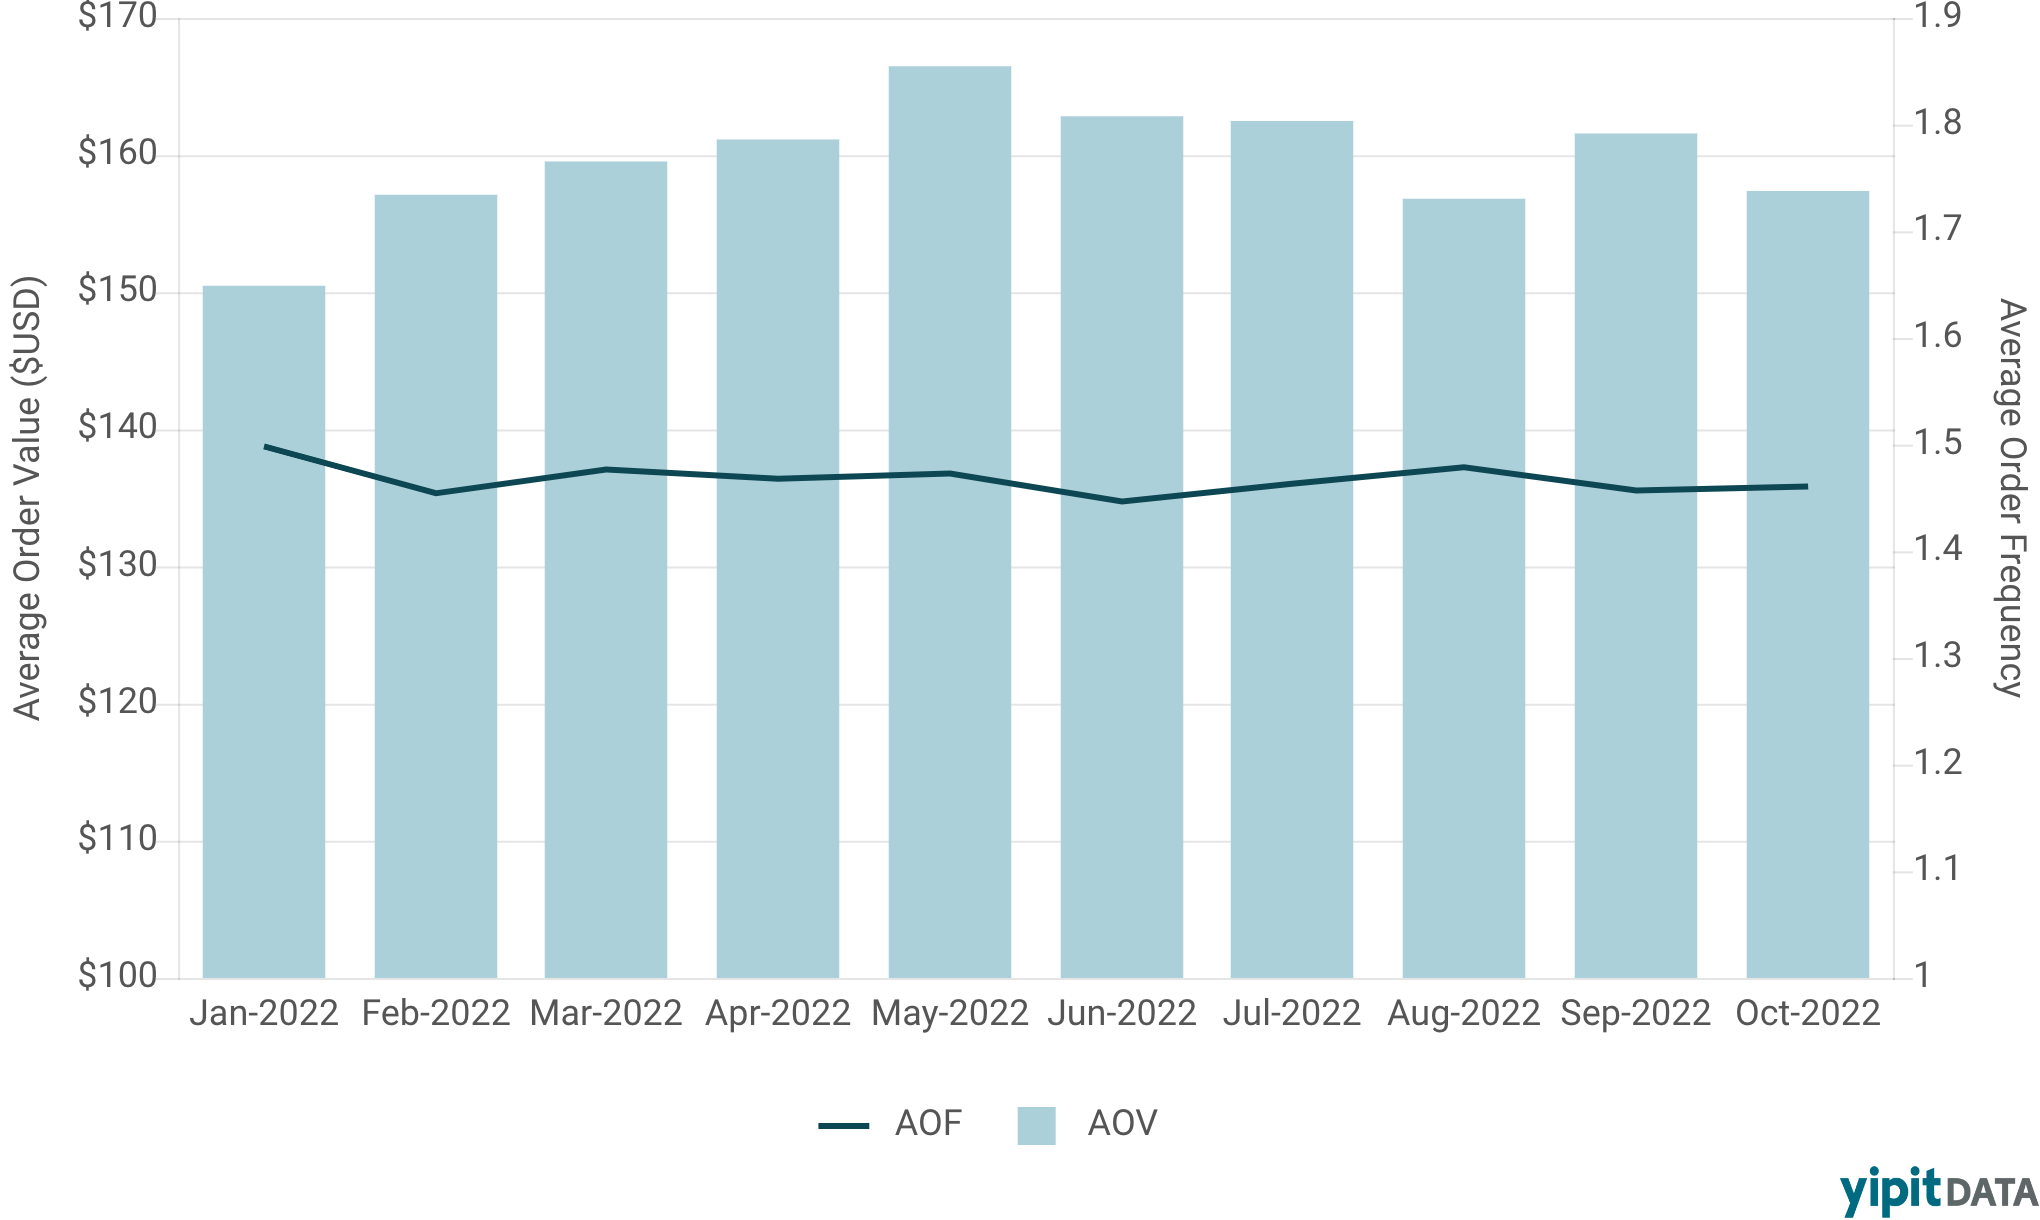
Consumers spend more per order at home goods pure players than mass retailers
Average order values (AOV) for pure players in the home market have increased over the year, suggesting either brand-led price hikes or consumers adding more items to their order. On average, between January and October 2022, consumers spent between $150 and $166 at these home specialists and purchased about 1.5 times a month. This frequency was relatively stable throughout the year.
Average Order Value and Average Order Frequency, Pure Players
United States, Online + Offline | January 2022 - October 2022
Mass retailers, however, commanded relatively inexpensive consumer baskets in the home category: average selling price (ASP) ranged between $26 and $32 from January to October 2022. ASP in October 2022 was only $28.51, a 8% decrease YoY. This suggests that mass home consumers are generally buying from more inexpensive subcategories – such as decor or sheets – rather than higher-priced furniture.
However, the ordering frequency for consumers buying home goods at mass retailers is consistently higher than for consumers purchasing from home-specific retailers.
Average Sales Price and Average Order Frequency, Mass Retailers
United States, Online | January 2022 - October 2022
Sources: Transaction data and email receipt data
Curious to learn more about consumers’ retail baskets during times of inflation? Subscribe to our Deep Dives.


